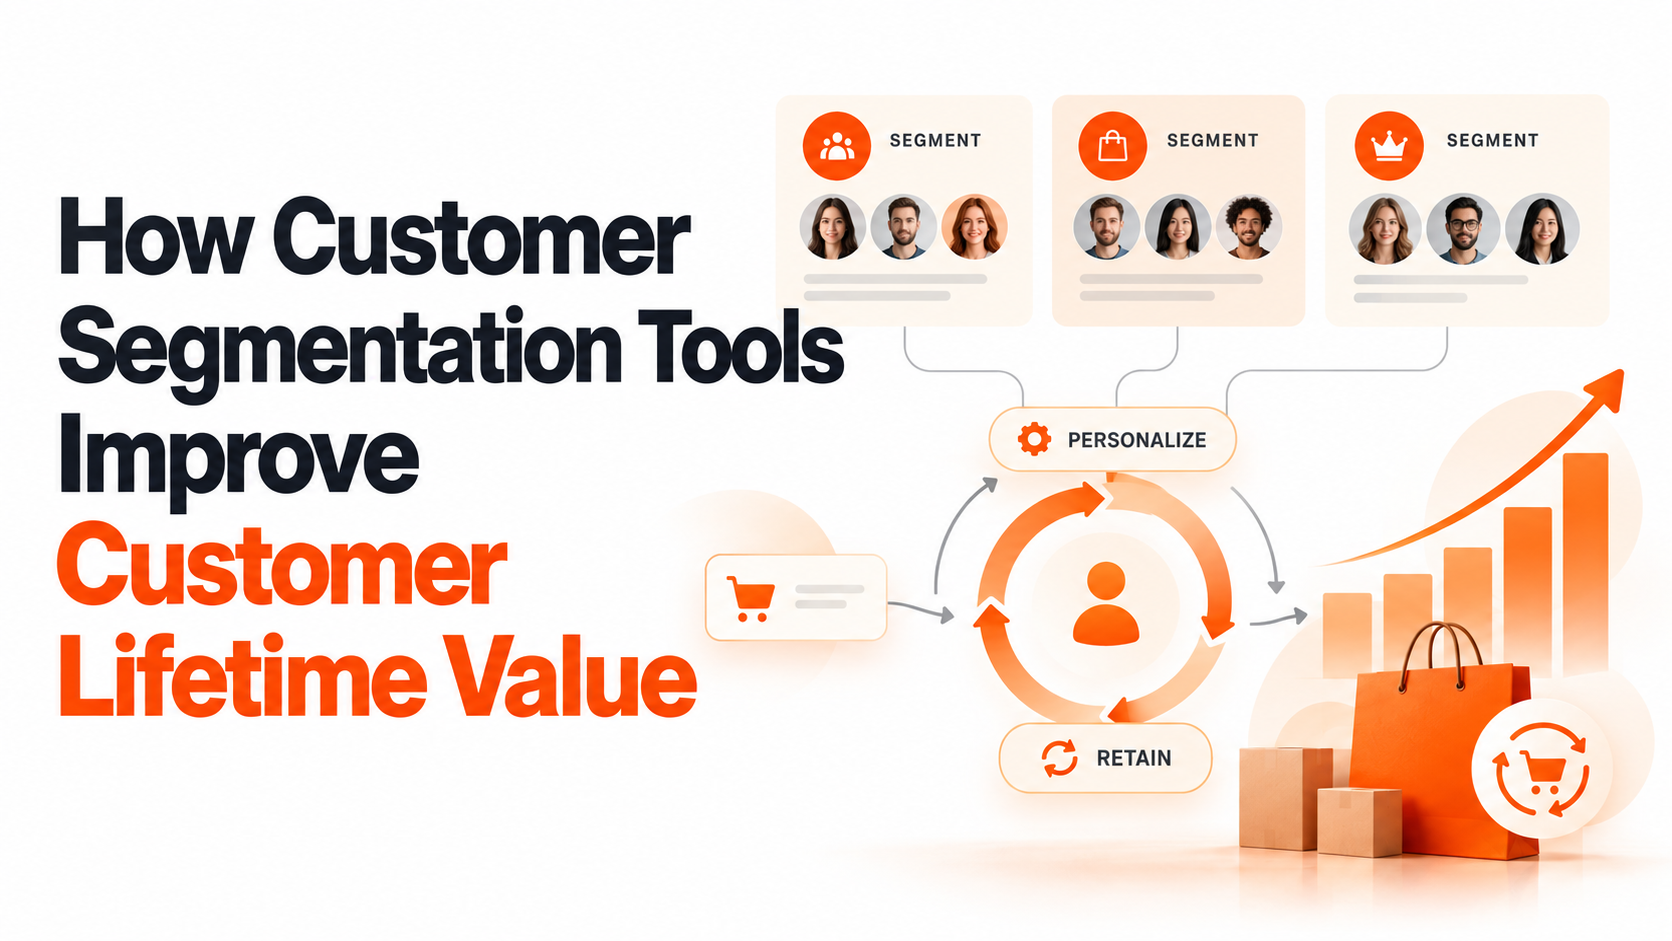
Short answer: Customer segmentation tools improve customer lifetime value by splitting buyers into groups that behave differently, then matching offers, timing, and spend to each group. A first-time discount shopper and a ninth-order loyalist stop receiving the same message. Repeat purchases and average order value rise while wasted spend falls. LayerFive supports this by resolving identities first, then building predictive audiences, so segments reflect real people and real revenue.
TL;DR
- Repeat customers are 21% of a store’s base but 44% of revenue — Rivo, 2026.
- Segmentation fails when data is fragmented: 98% of marketers report a data barrier to personalization — Salesforce State of Marketing (10th edition), 2026.
- Static demographic lists are the most common mistake. Behavior, recency, and predicted value separate high-value customers from one-time buyers.
- Three methods do most of the work: RFM analysis, behavioral segmentation, and predictive customer analytics with churn prediction.
- Good customer segmentation software resolves identity, updates segments in real time, and pushes audiences into ad and email channels.
- Measure success by cohort CLV, repeat purchase rate, and revenue per segment, not by open rates.
- A 90-day rollout (unify data, build five segments, test one play per segment) is enough to prove or disprove the lift.
Introduction
Most ecommerce brands treat a customer who bought once on a 40% discount and a customer on her ninth order as the same email address. That single mistake quietly caps customer lifetime value. According to Rivo’s 2026 retention benchmarks, repeat customers make up just 21% of a store’s base yet generate 44% of revenue. Customer segmentation tools exist to close that gap.
Acquisition is getting more expensive while the best revenue sits with people you already know. Ringly’s 2026 acquisition cost review puts ecommerce CAC up roughly 40% since 2023. Yet only 18% of companies focus more on retention than acquisition, per DemandSage figures reported in 2026. Most teams know this. They still send one-size-fits-all campaigns because their data is scattered across five tools.
This guide explains how customer segmentation tools raise customer lifetime value, which methods matter, what to demand from customer segmentation software, and how to roll it out in 90 days. You will leave with a working framework and a way to prove the lift.
Why Customer Lifetime Value Stalls for Most Ecommerce Brands
Customer lifetime value stalls because most brands lose the majority of buyers after the first order and keep paying more to replace them. Ecommerce stores lose 70–75% of their customer base each year, according to Rivo’s 2026 benchmarks, while average retention sits near 30%. Every lost buyer forces another round of paid acquisition at a higher cost, which compresses margin before a second purchase happens.
Customer lifetime value (CLV) is the total net revenue a customer generates over the full relationship with a brand. The formula most teams use is average order value × purchase frequency × customer lifespan, then adjusted for margin. Small shifts in any of the three inputs compound, which is why segmentation, which moves all three, has an outsized effect.
| Benchmark (ecommerce, 2026) | Figure | Source |
|---|---|---|
| Average retention rate | ~30% (top performers 62%) | Rivo, 2026 |
| Annual customer loss | 70–75% | Rivo, 2026 |
| Repeat customers: share of base vs. revenue | 21% vs. 44% | Rivo, 2026 |
| Average repeat purchase rate | 28.2% | Ringly, 2026 |
| Revenue from the top 5% of customers | 35% | Ringly, 2026 |
| Average ecommerce CLV | $100–$300 | Ringly, 2026 |
| Profit lift from a 5% retention gain | 25–95% | Bain & Company, via Rivo, 2026 |
The Acquisition Cost Squeeze
Rising acquisition cost is the pressure that makes lifetime value urgent. Ringly’s 2026 review reports that ecommerce customer acquisition cost is up roughly 40% since 2023, and Rivo notes that acquiring a customer costs 5 to 25 times more than retaining one. When paid media gets pricier, a first order alone rarely repays its cost, so the second and third orders decide profit.
Think about what that means for budget. If a first purchase barely breaks even, every dollar spent on a customer who never returns is a subsidy. Segmentation shows you which first-time buyers look like future repeat customers, so you can spend retention effort where it pays back instead of spreading it evenly.
The Repeat Purchase Gap
The repeat purchase gap is the distance between the customers a brand wins and the customers it keeps. Rivo’s 2026 category data shows pet supplies above 30% repeat rate, health and supplements near 29%, and beauty at 25.9%. Brands below their category norm are not unlucky. They are usually under-segmented and sending the same post-purchase flow to everyone. Segmentation addresses that gap directly.
The gap also shows up inside a single store. Ringly’s 2026 loyalty review reports that 41% of ecommerce revenue comes from only 8% of customers. That concentration means one segment, your best customers, can carry the business. Losing a handful of them hurts more than losing hundreds of one-time buyers.
Why Averages Hide Your Best and Worst Customers
Averages hide your best and worst customers because a blended metric treats very different buyers as one population. A store with a $60 average order value might have a loyal group spending $140 and a discount-driven group spending $35. Reporting the mean tells you nothing about either group, and any campaign built on it fits neither. Segmentation replaces that blur with distinct, actionable groups.
The root cause is rarely a lack of data. It is fragmented data. Salesforce’s 10th State of Marketing report, which surveyed 4,450 marketers across 26 countries, found that 98% of teams using AI hit at least one data-related barrier to personalization, including silos and poor data quality. Segments built on broken inputs are broken segments.
Fragmented Data Produces Fragmented Segments
Fragmented data produces fragmented segments because each platform sees only its own slice of the customer. The ad platform sees clicks, the email tool sees opens, the store sees orders, and none of them agree on who the buyer is. A segment assembled from three partial views will mislabel customers, double count some, and miss others entirely. Clean, unified inputs come before clever models.
Salesforce’s 2026 report also found that 78% of marketers say they need more personalized content than they can produce. That is a capacity problem, but it is also a data problem. You cannot personalize for a group you cannot reliably identify, and you cannot scale personalization on segments that change meaning between tools.
The Identity Gap Behind Every Segment
The identity gap is the share of your traffic and customers you cannot recognize across sessions, devices, and channels. Industry-standard tracking typically identifies only 5–15% of site visitors. Every unrecognized visitor is a customer with no history, which means no recency, no frequency, and no value score. Segmentation can only classify people it can recognize. Recognition is the foundation every other segmentation step depends on.
This is why identity resolution comes before segmentation, not after. Identity resolution in marketing analytics links the browsing session, the email click, and the purchase to one person. Without that link, a returning customer on a new device looks like a stranger, and gets welcomed with a first-order discount.
What the Industry Gets Wrong About Customer Segmentation
The industry gets segmentation wrong by treating it as a one-time list-building exercise based on demographics. Age, gender, and location describe who someone is, not how they buy. Two shoppers with identical profiles can have opposite purchase histories. Segments that ignore behavior, timing, and predicted value produce campaigns that feel personal but perform like broadcast. Fixing this starts with four specific misconceptions.
There are four misconceptions worth naming, because each one costs real revenue.
Misconception 1: Demographics are enough. They are a starting point. Behavior predicts the next purchase far better than age does. HubSpot’s 2026 State of Marketing report found that 91% of marketers say personalization improves engagement, but engagement only converts to lifetime value when the personalization reflects what customers actually do.
Misconception 2: More segments are better. Not true. Twenty segments that nobody has a distinct play for are noise. Start with five segments you will act on, then split further only when a segment is large enough and different enough to justify its own message.
Misconception 3: Discounts keep customers. A blanket discount trains buyers to wait for the next one. Segmentation lets you reserve incentives for lapsing customers and give loyal buyers early access or recognition instead, which protects margin.
Misconception 4: Segmentation is an email tactic. Email is one channel. The same segments should inform paid audiences, on-site experiences, and support priority. Ringly’s 2026 compilation, citing McKinsey, reports personalization drives a 5–25% revenue lift depending on industry, and that lift only appears when segments reach every touchpoint.
How Customer Segmentation Tools Improve Customer Lifetime Value
Customer segmentation tools improve customer lifetime value through four mechanisms: they raise repeat purchase rate with timed follow-ups, increase average order value through relevant offers, reduce churn by flagging at-risk buyers early, and lower acquisition cost by finding lookalikes of your best customers. Each mechanism moves one input of the CLV formula. Pick the method that matches your data maturity, then layer on the others as identity improves.
The tools differ mainly in how they build segments. The table below compares the four methods most ecommerce teams use, and where each fits.
| Method | Segments built on | Best for | Main limit |
|---|---|---|---|
| RFM analysis | Recency, frequency, monetary value | Fast wins from existing order data | Looks backward only |
| Behavioral segmentation | Browsing, cart, product, and channel actions | On-site and lifecycle personalization | Needs reliable identity |
| Predictive customer analytics | Modeled likelihood to buy, churn, or spend | Prioritizing spend and retention effort | Needs enough history |
| AI-powered customer segmentation | Machine-discovered clusters across many signals | Finding patterns humans miss | Needs clean unified data |
RFM Analysis: The Fastest Place to Start
RFM analysis scores every customer on three questions: how recently they bought, how often they buy, and how much they spend. Combining the scores creates segments such as champions, loyal customers, at-risk buyers, and lost customers. It needs only order data, so most Shopify stores can run it this week. It is the lowest-effort route to measurable lift. Start here before buying anything more advanced.
The value of RFM is clarity. A champion who bought 12 days ago gets early access and a referral ask. An at-risk buyer who has gone quiet past their usual reorder window gets a win-back. Both actions come straight from the score. For more on building these groups in a store, see customer segmentation tools for ecommerce.
Behavioral Segmentation: Act on What Customers Do
Behavioral segmentation groups customers by their actions: products viewed, carts abandoned, categories purchased, channels used, and content engaged with. It answers what a customer is trying to do right now. A visitor who viewed three skincare serums twice needs different content from one who only read the returns policy. Without it, every customer looks identical on the day they arrive. Timing matters as much as content.
Behavior also drives personalized customer journeys. Involve.me’s 2026 personalization review reports that product recommendations can account for up to 31% of ecommerce revenue. Recommendations work because they respond to behavior. They fail when the behavior is attributed to the wrong person, which is why identity quality matters as much as the model.
Predictive Customer Analytics and Churn Prediction
Predictive customer analytics uses historical patterns to estimate what each customer is likely to do next: buy again, spend more, or leave. Churn prediction is the most valuable output, because it flags buyers drifting away while a retention message can still work. It converts retention from a reaction into a scheduled action. This makes spend decisions far more precise than looking at past orders alone.
Predicted value changes how you spend. Instead of treating all new customers equally, you can identify who is likely to become a top-quintile buyer and invest in their second order. Salesforce’s 2026 report lists predicting campaign performance and ROI among the top AI use cases for marketers, which reflects how much weight teams now place on prediction over description.
AI-Powered Customer Segmentation
AI-powered customer segmentation uses machine learning to discover groups across dozens of signals at once, instead of relying on rules a marketer defines by hand. It can surface a cluster no one predicted, such as buyers who purchase only after a specific content sequence. It also refreshes segments continuously, so customers move between groups as behavior changes. Treat it as an accelerator for clean data, not a substitute.
The caveat is data quality. AI amplifies whatever it is fed. Ringly’s 2026 compilation reports that 89% of companies implementing AI personalization see positive ROI with an average payback of nine months, but those results depend on unified inputs. For a deeper walkthrough, read AI customer segmentation marketing tools.
Where LayerFive Fits in a Segmentation Stack
LayerFive fits at the two points where segmentation usually breaks: knowing who the customer is, and acting on what the data says. Signal handles identity resolution and attribution, Edge builds predictive audiences and activates them, and Juno, LayerFive’s agentic AI, answers segment questions in plain language. Each addresses a specific failure described above, so you can adopt them in order.
Signal addresses the identity gap. LayerFive states that it identifies 2–5× more visitors than the industry standard of 5–15%, which gives segments far more recognized customers to work with. A larger recognized base means RFM scores and behavioral histories cover real buyers instead of anonymous sessions. See Signal for how identity and attribution connect.
Edge addresses the activation gap. Edge builds predictive audiences from unified first-party data and pushes them to the channels where you buy and message. A segment such as “likely to churn within 30 days” is only useful if it reaches your email and ad platforms before the customer leaves.
Juno addresses the speed gap. Juno lets a marketer ask which segment is growing fastest or which cohort has the highest repeat rate, without waiting for an analyst. LayerFive also holds ISO 27001 and SOC 2 Type 2 certifications, which matters when segments are built on customer-level data.
Underneath all three sits first-party data. If you are building that foundation on Shopify, first-party data for Shopify explains what to collect and why it matters for segmentation. And how a customer data platform improves segmentation covers the CDP layer that makes unified segments possible.
What to Look For in Customer Segmentation Software
Good customer segmentation software resolves identity before it segments, updates groups in real time, supports RFM, behavioral, and predictive methods in one place, and pushes audiences directly into ad, email, and on-site channels. If a tool cannot do the last step, segments stay trapped in a dashboard and never change a customer’s experience. Treat these as non-negotiable requirements, not nice-to-have features.
Use this checklist when you evaluate tools. Each question maps to a failure covered earlier.
| Capability to test | Why it matters | Question to ask a vendor |
|---|---|---|
| Identity resolution | Segments need recognized people | What share of visitors do you identify across devices? |
| First-party data foundation | Third-party signals keep fading | Does segmentation run on data we own? |
| Real-time updates | Customers change segments quickly | How fast does a purchase move a customer between groups? |
| Predictive scoring | Prioritizes spend and retention | Can you score churn risk and predicted CLV per customer? |
| Channel activation | Segments must reach customers | Which platforms receive audiences natively? |
| Revenue reporting by segment | Proves the lift | Can I see CLV and repeat rate per segment over time? |
| Security and compliance | Customer-level data carries risk | Which certifications do you hold? |
Speed matters more than most buyers expect. Salesforce’s 2026 report found that 69% of marketers still struggle to respond quickly to customer interactions. A segment that updates nightly is already stale for a customer who just abandoned a cart. Ask for the real refresh time, not the marketing claim.
Reporting is the other common gap. A tool that builds elegant segments but cannot show revenue per segment leaves you guessing. Pair segmentation with attribution so you know which acquisition channel produces your highest-CLV segment. Ecommerce attribution beyond last click explains why last-click data misleads here.
How to Use Customer Segmentation to Increase Repeat Purchases
To increase repeat purchases, build five behavior-based segments, assign each one a single retention play, and measure repeat rate per segment weekly. The sequence matters: unify data first, score customers second, act third. Skipping the first step is why most segmentation projects produce a spreadsheet and no revenue. Seven steps cover the whole sequence, and the order is deliberate. Each one builds on the last.
Follow these steps in order.
- Unify your data. Connect store orders, email engagement, ad clicks, and on-site behavior so one customer has one profile. Without this, every later step inherits errors.
- Score every customer with RFM. Rank recency, frequency, and monetary value, then group customers into champions, loyal, promising, at-risk, and lost.
- Add one behavioral layer. Flag category interest, cart abandonment, and discount sensitivity so you know what each group wants and what it responds to.
- Add predicted value and churn risk. Use predictive customer analytics to score each customer’s likelihood to repurchase and to leave.
- Assign one play per segment. Keep it simple: champions get early access, promising buyers get a replenishment or cross-sell prompt, at-risk buyers get a timed win-back.
- Push segments to every channel. Use the same groups for email, paid audiences, and on-site content so the message stays consistent.
- Review monthly and retire what does not work. Drop plays that show no lift and promote ones that do.
| Segment | Signal | Retention play | Metric to watch |
|---|---|---|---|
| Champions | Recent, frequent, high spend | Early access, referral ask | Referral rate, AOV |
| Loyal | Frequent, steady spend | Loyalty perks, bundles | Repeat purchase rate |
| Promising | One or two recent orders | Replenishment or cross-sell | Second-order rate |
| At-risk | Past usual reorder window | Win-back with relevant offer | Reactivation rate |
| Lost | Long inactive | Low-cost reactivation test | Revenue per send |
Customer retention strategies work best when the offer matches the reason a customer is quiet. A lapsed supplement buyer has likely run out of product and needs a reorder reminder, not a 30% coupon. For a fuller treatment, see customer segmentation that converts.
Customer Segmentation Strategies for High-Value Customers
Segmentation strategies for high-value customers focus on three jobs: identify them early, protect them from churn, and find more people like them. Because a small group drives a large share of revenue, even a modest improvement in how you treat this segment moves total CLV more than broad improvements across everyone. That concentration makes this group the highest-leverage place to invest.
Ringly’s 2026 loyalty review reports that the top 5% of customers generate 35% of total ecommerce revenue. Build a dedicated high-value segment using both history and prediction, so you include customers who have not yet spent much but behave like past big spenders.
Identify early. Compare first-order behavior of your best customers: product choice, channel, discount use, and time to second order. Customers matching that pattern deserve extra attention before they prove themselves.
Protect. Set alerts when a high-value customer’s order gap exceeds their normal window. A personal message or priority support often costs less than one paid click and retains far more revenue.
Replicate. Use the high-value segment as the seed for lookalike audiences in paid channels. This is where segmentation lowers acquisition cost: you pay to reach people who resemble your best customers instead of the average visitor. AI analytics for customer lifetime value shows how to model predicted value for this purpose.
How to Measure Whether Segmentation Raised Customer Lifetime Value
Measure segmentation by tracking cohort-based CLV, repeat purchase rate, and revenue per segment against a holdout group that receives no segmented treatment. A holdout isolates the effect of segmentation from seasonality and promotions. Without one, any lift you see could have happened anyway, and you cannot defend the budget. Anything less is guesswork dressed up as reporting. Set the test before launch, not after.
Do not rely on a blended CLV number. Compare cohorts acquired in the same period, with and without the segmented program, and track them for at least 90 days. Watch four metrics: repeat purchase rate, average order value, orders per customer, and churn rate. Ringly’s 2026 benchmark of a 28.2% average repeat purchase rate gives you a reference point.
Also track the cost side. If segmented campaigns raise revenue but require heavy discounts, margin-adjusted CLV may fall. Report CLV net of discount and acquisition cost. This is where unified reporting helps, because revenue, ad spend, and customer history sit in one view instead of three exports.
Case Study: What Billy Footwear’s Result Shows About Spend Allocation
Billy Footwear shows what happens when spend follows customer value instead of volume. LayerFive’s published case study reports 36% revenue growth with only 7% additional ad spend. The ratio is the point: growth far outpaced spend, which signals that budget moved toward audiences and customers that earned it rather than simply increasing. Read it as direction, not a promise. Your own mix and data will shape the outcome.
This is the practical promise of segmentation tied to measurement. When you know which customers and channels produce repeat revenue, you stop funding the ones that do not. Revenue grows faster than cost because you cut the spend that was never working. The result depends on a brand’s data and mix, so treat it as a benchmark for the direction of change, not a guarantee.
Your version of this starts small. Pick your highest-CLV segment, find the channel that acquires it most cheaply, and shift a modest portion of budget there. Measure the cohort for 90 days. If the numbers hold, scale. If not, you learned that cheaply.
Frequently Asked Questions
These ten questions cover what marketers ask most often about segmentation and lifetime value, phrased the way people type them into search engines and AI assistants. Each answer stands alone, so you can read the section top to bottom or jump straight to the one question that matches your current problem today. Answers are direct, with no hedging, and written for quick extraction.
Q: How do customer segmentation tools improve customer lifetime value?
A: Customer segmentation tools improve customer lifetime value by grouping buyers according to behavior and predicted value, then tailoring offers and timing to each group. This raises repeat purchase rate, lifts average order value, flags at-risk customers before they leave, and lowers acquisition cost through lookalike audiences. Each effect moves one input of the CLV formula, so the gains compound over time instead of arriving once.
Q: What is the best way to segment customers to increase repeat purchases?
A: The best approach combines RFM analysis with one behavioral layer. Score customers on recency, frequency, and spend, then add signals such as category interest and discount sensitivity. Assign one retention play to each of five core segments, such as replenishment prompts for promising buyers and timed win-backs for at-risk ones. Measure repeat purchase rate per segment every week and drop plays that show no lift.
Q: What is RFM analysis and how does it help ecommerce brands?
A: RFM analysis scores each customer on recency, frequency, and monetary value, then groups them into segments like champions, loyal customers, at-risk buyers, and lost customers. It helps ecommerce brands because it needs only order data and produces immediate actions. Champions receive early access and referral requests, while at-risk buyers get win-back messages timed to their usual reorder window, which protects revenue without blanket discounting.
Q: How does predictive segmentation help reduce customer churn?
A: Predictive segmentation estimates each customer’s likelihood of leaving by comparing current behavior against patterns from past churners, such as widening gaps between orders or falling engagement. It flags them while a retention message can still work. Teams then send targeted offers or support outreach to the highest-risk, highest-value customers first, which spends retention budget where it protects the most revenue.
Q: What is AI-powered customer segmentation?
A: AI-powered customer segmentation uses machine learning to discover customer groups across many signals at once, rather than relying on rules a marketer writes by hand. It surfaces patterns people miss and refreshes segments continuously as behavior changes. Its accuracy depends on clean, unified data, so identity resolution and first-party data collection should come before any AI model is applied to customers.
Q: What features should customer segmentation software have?
A: Customer segmentation software should resolve identity across devices, run on first-party data, update segments in real time, support RFM, behavioral, and predictive scoring, and push audiences to email, ad, and on-site channels. It should also report CLV and repeat rate per segment and hold recognized security certifications such as ISO 27001 or SOC 2 Type 2, since it processes customer-level data.
Q: How many customer segments should an ecommerce brand use?
A: Start with five segments: champions, loyal, promising, at-risk, and lost. Five is enough to assign a distinct retention play to each without overwhelming a small team. Add a new segment only when it is large enough to matter and different enough to need its own message. A segment without a unique action attached to it adds reporting clutter and no revenue.
Q: How do you calculate customer lifetime value for a segment?
A: Calculate segment CLV by multiplying the segment’s average order value by its average purchase frequency and its average customer lifespan, then subtract acquisition and discount costs to get a margin-adjusted figure. Use cohorts acquired in the same period so results are comparable. Recalculate monthly, and compare each segment against a holdout group to confirm that segmentation, not seasonality, caused any change.
Q: Can small Shopify brands use customer segmentation tools?
A: Yes. Small Shopify brands can start with RFM analysis using order data alone, which requires no data science team. The practical limit is data fragmentation across email, ads, and store, so connect those sources first. A unified platform with identity resolution lets a small team run the same segmentation that larger brands use, without building custom pipelines or hiring analysts.
Q: How long does it take to see customer lifetime value improvements from segmentation?
A: Expect early signals in 30 to 60 days, such as higher second-order rate and better email revenue per recipient. Full CLV movement takes 90 to 180 days because customer lifetime value is a cohort metric that needs repeat orders to accumulate. Run a holdout group from day one so you can attribute the change to segmentation and report it with confidence.
Conclusion
Customer lifetime value rises when you stop treating customers as an average. Segmentation separates your loyal buyers from your one-time discount shoppers, shows who is about to leave, and tells you where to spend. The methods are not exotic: RFM analysis, behavioral groups, and predictive scoring, all built on data that identifies people correctly. The sequence is simple even if the execution takes discipline.
The tools only work as well as the data under them. Fix identity first, unify first-party data second, then segment and act. Start with five segments, one play each, and a holdout group, and let the cohort numbers decide what to keep.
If you’re ready to stop guessing and start measuring what actually works, see how LayerFive approaches predictive audiences and activation: LayerFive Edge.
Key Statistics Used (2026 Data)
Every figure below comes from a named 2026 source and is listed with its link for fact-checking. Where a number originates with a primary research firm such as Bain, McKinsey, or Salesforce but was read through a secondary publication, the list names both, so reviewers can trace each claim back to the report that first published it, and confirm the year, sample, and wording before the post goes live.
- Repeat customers are 21% of a store’s customer base but generate 44% of revenue — Rivo, 2026. Source
- Ecommerce stores lose 70–75% of their customer base annually — Rivo, 2026. Source
- Average ecommerce retention rate is about 30%, with top performers at 62% — Rivo, 2026. Source
- A 5% retention increase can lift profits 25–95% (Bain & Company research) — as reported by Rivo, 2026. Source
- Acquiring a customer costs 5–25× more than retaining one — Rivo, 2026. Source
- Pet supplies repeat rate above 30%; health and supplements near 29%; beauty 25.9% — Rivo, 2026. Source
- Ecommerce customer acquisition cost is up roughly 40% since 2023 — Ringly, 2026. Source
- Only 18% of companies focus more on retention than acquisition (DemandSage) — as reported by Ringly, 2026. Source
- Average ecommerce repeat purchase rate is 28.2% — Ringly, 2026. Source
- The top 5% of customers generate 35% of ecommerce revenue; 41% of revenue comes from 8% of customers — Ringly, 2026. Source
- Average ecommerce CLV falls between $100 and $300 — Ringly, 2026. Source
- Personalization drives a 5–25% revenue lift depending on industry (McKinsey); 89% of companies implementing AI personalization report positive ROI with a nine-month average payback — as reported by Ringly, 2026. Source
- Product recommendations can account for up to 31% of ecommerce revenue — Involve.me, 2026. Source
- 98% of marketers using AI hit at least one data barrier to personalization — Salesforce State of Marketing, 10th edition, 2026. Source
- Salesforce State of Marketing, 10th edition: 4,450 marketers across 26 countries — Salesforce, 2026. Source
- 78% of marketers need more personalized content than they can produce; 69% struggle to respond quickly to customer interactions — Salesforce State of Marketing, 2026. Source
- 91% of marketers say personalization improves engagement — HubSpot State of Marketing, 2026. Source
- Salesforce State of Marketing report page — Source
LayerFive proof points referenced: Billy Footwear case study (36% revenue growth with 7% additional ad spend); identification of 2–5× more visitors than the 5–15% industry standard; ISO 27001 and SOC 2 Type 2 certification.