
Marketing agencies managing multiple clients face a universal challenge: fragmented reporting tools that drain time, inflate costs, and create operational chaos. Research shows that agencies spend an average of 15-20 hours per week per client simply compiling reports from disparate data sources. For agencies managing 5+ clients, this translates to hundreds of hours monthly—time that could be spent on strategic work that actually grows client accounts.
This comprehensive guide reveals how forward-thinking agencies are consolidating their client reporting infrastructure, reducing tool costs by $100K-$300K annually per client, and transforming their operations from reactive data wranglers to proactive growth partners.
What you’ll learn:
- The true cost of fragmented reporting tools (it’s far more than you think)
- How agency-specific unified marketing data platforms deliver ROI
- Step-by-step implementation strategies that won’t disrupt client relationships
- Real-world case studies showing 72% revenue increases with minimal additional spend
- Commission structures and pricing models that make consolidation profitable
The Agency Reporting Crisis: Why Traditional Tools Are Failing
The Fragmentation Problem
Picture this: It’s Monday morning, and your team faces another week of report generation for seven active clients. Each client requires data from 8-12 different platforms: Google Ads, Meta Ads Manager, LinkedIn Campaign Manager, TikTok Ads, email marketing platforms, e-commerce systems, CRM data, and more.
Your data analyst opens browser tab after browser tab, manually exporting CSV files from each platform. Then comes the laborious process of cleaning the data—standardizing date formats, reconciling naming conventions, removing duplicate entries, and dealing with platform-specific quirks. Next, they’ll copy-paste this data into spreadsheets, build pivot tables, create charts, and finally assemble everything into a client-facing report.
This process repeats for every single client. Every single week.
This isn’t just inefficient—it’s unsustainable.
The Evolution of Marketing Complexity
The marketing landscape has exploded in complexity over the past five years. According to recent industry research, the average marketing technology stack has grown from 12 tools in 2018 to 23 tools in 2024. For agencies managing multiple clients, this multiplication effect is staggering.
Each client brings their own unique combination of:
- Advertising platforms (Google, Meta, LinkedIn, TikTok, Pinterest, Snapchat, Reddit)
- E-commerce systems (Shopify, WooCommerce, BigCommerce, Magento)
- Email marketing tools (Klaviyo, Mailchimp, SendGrid, HubSpot)
- CRM platforms (Salesforce, HubSpot, Pipedrive)
- Analytics tools (Google Analytics, Adobe Analytics, Mixpanel)
- Attribution platforms (or lack thereof)
- Data warehouses and BI tools
Managing this complexity requires either:
- Massive teams of data analysts working around the clock
- Expensive tool subscriptions to platforms like Supermetrics, Funnel.io, Looker, Tableau, or PowerBI
- Custom development to build proprietary data pipelines (expensive and fragile)
- All of the above (the most common and costly approach)
Why Traditional Solutions Fall Short for Agencies
Traditional reporting solutions were built for individual companies, not multi-client agency operations. Here’s why they fail agencies:
Supermetrics + BI Tools (Looker, Tableau, PowerBI)
- Cost: $100-300 per client per month for Supermetrics, plus $70-180 per user per month for BI tools
- Complexity: Requires deep technical expertise to set up and maintain
- Scalability: Each new client requires significant setup time
- Attribution: No built-in attribution capabilities—just data aggregation
- Client Access: Difficult to provide clients secure, branded access to their data only
Funnel.io + Data Warehouse + BI
- Cost: $1,500-3,000 base monthly cost, plus warehouse and BI tool costs
- Technical Overhead: Requires data engineering expertise
- Setup Time: 2-4 weeks minimum per client
- Attribution: Still requires separate attribution platform
- Maintenance: Constant connector updates and schema changes
Individual Platform Tools (TripleWhale, Northbeam)
- E-commerce Focused: Don’t work well for B2B or service-based clients
- Limited Integrations: Typically 10-15 connectors vs. 100+ needed
- No Agency Features: No multi-client dashboard or access controls
- Cost Per Client: $299-1,999 per client per month
The Real Impact on Agency Operations
The fragmentation crisis impacts agencies across multiple dimensions:
1. Time Drain Data analysts spend 50-70% of their time on data wrangling instead of analysis. For a team of 3 analysts at $75K average salary, that’s $112,500 annually spent just moving data around.
2. Cost Accumulation For an agency managing 10 clients:
- Data integration tools: $3,000-6,000/month
- BI platform licenses: $2,000-5,000/month
- Attribution tools: $5,000-15,000/month
- Creative analytics: $1,500-12,000/month
- Total: $138,000-456,000 annually
3. Scalability Constraints Every new client requires:
- 10-15 hours of data source setup
- Custom dashboard development
- Ongoing maintenance overhead
- Additional tool licenses
This limits how many clients an agency can effectively serve.
4. Client Satisfaction Issues Delayed reports, data discrepancies between platforms, and inability to answer questions in real-time all erode client confidence. In competitive agency landscapes, this translates directly to churn.
5. Strategic Capability Gap When your team is buried in data wrangling, they can’t focus on what agencies should excel at:
- Strategic recommendations
- Campaign optimization
- Creative performance analysis
- Growth experimentation
- Proactive insights
The Hidden Costs of Fragmented Reporting Stacks
When agencies calculate the cost of their reporting infrastructure, they typically only consider obvious line items: tool subscriptions and analyst salaries. But the true cost runs far deeper.
Direct Costs: The Obvious Expenses
Tool Stack Subscription Costs For a typical agency managing 10 clients:
Data Integration Layer:
- Supermetrics: $300/month × 10 clients = $3,000/month
- OR Funnel.io: $2,000-3,000/month base + volume pricing
BI & Visualization:
- Looker: $3,000-5,000/month (platform license)
- OR Tableau: $70/user × 15 users = $1,050/month
- OR PowerBI: $10-20/user × 15 users = $150-300/month
Attribution & Analytics:
- Northbeam: $999-1,999/client × 10 = $10,000-20,000/month
- OR Hyros: Similar pricing tier
- OR custom attribution solution: $5,000-15,000/month development + maintenance
Creative Analytics:
- Motion: $499-999/month per account
- OR Smartly.io: $1,500-10,000/month
- OR Foreplay: $99-399/month per user
Total Direct Tool Costs: $138,000-456,000 annually
Hidden Costs: The Real Drain
1. Personnel Time Costs (The Biggest Hidden Expense)
Data Analyst/Engineer Time:
- Data extraction and cleaning: 15 hours/week per client
- For 10 clients: 150 hours/week = 3.75 FTE analysts
- At $75K average salary + 30% benefits: $365,625/year
Account Manager Time:
- Report compilation and formatting: 5 hours/week per client
- For 10 clients: 50 hours/week = 1.25 FTE account managers
- At $65K average salary + 30% benefits: $105,625/year
Technical Support Time:
- Troubleshooting broken connectors: 10 hours/week
- Maintaining dashboards: 8 hours/week
- Training new team members: 5 hours/week
- Total: 23 hours/week = 0.575 FTE technical staff
- At $85K average salary + 30% benefits: $63,538/year
Total Hidden Personnel Costs: $534,788 annually
2. Opportunity Costs
Lost Revenue from Capacity Constraints: If your team is spending 150 hours/week on data wrangling, that’s capacity that could serve 2-3 additional clients at $5,000-10,000/month each. That’s $120,000-360,000 in lost annual revenue.
Strategic Work Not Happening: Time spent on manual reporting isn’t spent on:
- Campaign optimization (could improve client ROAS by 15-30%)
- Creative testing frameworks (could improve creative ROI by 20-40%)
- Market research and competitive intelligence
- Client strategy sessions and proactive recommendations
If better strategic focus improved client results by just 10%, and that reduced churn by 20%, the value is enormous. For an agency with $1.2M annual revenue, reducing churn from 20% to 16% saves $48,000 annually.
3. Error and Rework Costs
Data Discrepancies: Manual data handling inevitably introduces errors:
- Incorrect metric calculations (happens in 15-25% of manual reports)
- Mismatched date ranges
- Platform naming inconsistencies
- Currency conversion errors
Each error requires:
- Time to identify: 2-4 hours
- Time to fix: 1-3 hours
- Client communication overhead: 1-2 hours
- Trust erosion (unmeasurable but real)
With 40 reports monthly (10 clients × 4 weeks), even a 10% error rate means 4 incidents monthly = 24-36 hours of rework = $3,600-5,400 annually at $150/hour loaded cost.
4. Client Onboarding Friction
Time to First Value: With fragmented tools, new client onboarding takes:
- Data source connection setup: 10-15 hours
- Custom dashboard development: 15-25 hours
- Testing and validation: 5-10 hours
- Total: 30-50 hours = 1-1.5 weeks
This delay impacts:
- Cash flow (delay in billing)
- Client confidence (slow start creates doubt)
- Team capacity (extended onboarding period)
5. Tool Maintenance and Technical Debt
Ongoing Maintenance Requirements:
- API changes requiring connector updates: 2-4 hours/month per client
- Dashboard updates for new metrics: 3-6 hours/month per client
- Platform updates breaking integrations: 5-10 hours/month across all clients
- Total: 30-50 hours/month = $4,500-7,500/month = $54,000-90,000/year
6. Client Dissatisfaction and Churn
Impact of Poor Reporting:
- Delayed reports create perception of poor management
- Data discrepancies reduce trust in agency recommendations
- Inability to answer ad-hoc questions signals lack of control
- Slow turnaround on strategic questions limits partnership depth
Research shows that reporting quality correlates directly with client retention. Agencies with streamlined reporting see 15-25% lower churn rates.
For an agency with $1.2M revenue and 20% annual churn:
- Churn loss: $240,000/year
- If reporting improvements reduce churn to 15%: $180,000/year
- Value of improvement: $60,000/year
Total Cost of Fragmented Reporting
Summary for Agency Managing 10 Clients:
- Direct tool costs: $138,000-456,000
- Hidden personnel costs: $534,788
- Lost capacity revenue: $120,000-360,000
- Error/rework costs: $3,600-5,400
- Maintenance costs: $54,000-90,000
- Churn impact: $60,000
Total Annual Cost: $910,388-1,506,188
Per Client: $91,039-150,619 annually
This is the true cost agencies face. And it’s why consolidation isn’t just about efficiency—it’s about survival and profitability.
What Agencies Really Need: Core Requirements for Unified Reporting
Before diving into solutions, let’s establish what agencies actually need from a unified reporting platform. These requirements emerge from hundreds of conversations with agency leaders managing 5-50+ clients.
1. Multi-Client Architecture from Day One
Agency-Level Dashboard: A single pane of glass showing all clients simultaneously:
- Aggregate performance metrics across portfolio
- Individual client performance snapshots
- Alert notifications for any client anomalies
- Quick-switch between client views without logging out
- Portfolio-level trends and benchmarks
Client Isolation and Security: Each client sees only their data, with zero risk of data leakage:
- Separate data environments per client
- Granular permission controls
- White-label option for agency branding
- Audit logs showing who accessed what data when
Scalable Onboarding: Adding a new client shouldn’t require engineering work:
- Pre-built templates for common client types (e-commerce, SaaS, B2B services)
- One-click data source connections (not weeks of setup)
- Automated dashboard generation
- Time to first report: under 1 hour (not 1-2 weeks)
2. Comprehensive Data Integration
Breadth of Connectors: Connect to everything clients actually use:
- Ad Platforms: Google Ads, Meta (Facebook/Instagram), LinkedIn, TikTok, Pinterest, Snapchat, Reddit, Twitter, Bing
- E-commerce: Shopify, WooCommerce, BigCommerce, Magento, custom platforms
- Email/SMS: Klaviyo, Mailchimp, SendGrid, Attentive, Postscript
- CRM: Salesforce, HubSpot, Pipedrive, Copper
- Analytics: Google Analytics, Adobe Analytics, Mixpanel, Amplitude
- Other: Affiliate networks, webinar platforms, event systems, review platforms
Agencies need 100+ connectors, not 10-15.
Real-Time Data Access: No more stale dashboards:
- Hourly (or more frequent) data refreshes
- Real-time spend tracking to prevent budget overruns
- Immediate visibility into campaign changes
Historical Data Depth: Strategic analysis requires history:
- 18-24 months minimum data retention
- Ability to analyze year-over-year trends
- Cohort analysis across extended timeframes
3. Built-In Attribution and Analytics
Most data aggregation tools just collect numbers. Agencies need actionable intelligence.
Multi-Touch Attribution: Understand the true customer journey:
- First-touch, last-touch, linear, time-decay, position-based models
- Custom attribution models
- Cross-device and cross-browser tracking
- View-through attribution (not just click-through)
Funnel Analytics: See where prospects drop off:
- Complete funnel visualization from awareness to conversion
- Drop-off analysis at each stage
- Conversion rate trends over time
- Segment-specific funnel performance
Media Mix Modeling: Predict optimal budget allocation:
- Channel effectiveness scoring
- Budget reallocation recommendations
- Incrementality analysis (what’s actually driving new revenue)
- Scenario modeling (“what if we shift 20% from Meta to Google?”)
Halo Effect Analysis: Measure indirect channel influence:
- How display ads impact direct traffic
- How social media exposure affects branded search
- Cross-channel influence mapping
4. Flexible Reporting and Dashboards
Pre-Built Templates: Start fast with professional reports:
- E-commerce performance dashboards
- SaaS funnel reports
- B2B lead generation views
- Agency executive summaries
- Channel-specific deep dives
Customization Without Code: Agencies need flexibility without technical overhead:
- Drag-and-drop dashboard builders
- Custom metric calculations
- Branded templates matching client identity
- Report scheduling and automated delivery
Multiple Output Formats: Different stakeholders need different formats:
- Live dashboards for daily monitoring
- PDF reports for executive reviews
- Slack/email summaries for quick updates
- API access for custom integrations
5. Creative Performance Analytics
Creative-Level Insights: Understanding what messaging and visuals work:
- Ad creative performance tracking across platforms
- Fatigue detection (when performance degrades)
- Creative element analysis (image vs. video, messaging themes)
- Best/worst performer identification
- Competitive creative intelligence
Actionable Recommendations: Not just data, but what to do about it:
- “Your primary CTA is fatiguing; refresh recommended”
- “Video creatives are outperforming static by 34%; increase video budget”
- “Testimonial-based ads show 2.1x ROAS vs. product-focused”
6. AI-Powered Insights and Automation
Proactive Anomaly Detection: The platform should alert you to problems:
- Sudden spend increases
- Performance drops
- Budget pacing issues
- Conversion rate anomalies
Automated Insights Generation: Save hours of analysis time:
- “Google Ads ROAS improved 23% week-over-week due to Shopping campaign optimization”
- “Instagram engagement down 15% likely due to decreased posting frequency”
- “Email open rates declining across all clients; testing new subject line framework recommended”
Agentic AI Capabilities: Next-generation automation:
- Natural language queries (“Which clients saw declining performance this week?”)
- Automated report generation
- Budget optimization recommendations
- Integration with enterprise AI tools via MCP server
7. Cost-Effectiveness
Transparent Pricing: No surprises or hidden fees:
- Clear per-client pricing tiers
- Volume discounts for agencies
- No per-user fees that punish team growth
- No surprise overage charges
All-in-One Value Proposition: Consolidate 5-10 tools into one:
- Data integration platform (replacing Supermetrics/Funnel)
- BI tool (replacing Looker/Tableau/PowerBI)
- Attribution platform (replacing Northbeam/Hyros)
- Creative analytics (replacing Motion/Smartly)
- ID resolution and audience building
Target Economics: For $200-500 per client per month, replace $1,000-3,000 in separate tools.
8. Agency-Specific Business Model Support
Commission Structures: Agencies deserve rewards for bringing clients:
- Revenue share for client subscriptions
- Long-term commission structures
- Incentive alignment with platform
Agency Management Tools: Operations built for multi-client management:
- Team member access controls
- Client permission management
- Agency-level usage analytics
- Bulk operations across clients
Client Success Features: Help agencies keep clients longer:
- Automated executive summaries
- Performance benchmark data
- Strategic recommendation engines
- Client retention risk scoring
The LayerFive Solution: Agency-Specific Features That Matter
LayerFive was built from the ground up to solve the exact problems agencies face. It’s not a single-company tool retrofitted for agencies—it’s a unified marketing data platform designed specifically for the multi-client agency model.
The Four-Product Ecosystem
LayerFive offers four integrated products that work together seamlessly. Agencies can start with one and expand, or implement the full suite for maximum impact.
LayerFive Axis: Unified Marketing Data and Reporting
LayerFive Axis is the foundation—a unified marketing data platform that consolidates all your client data sources and provides powerful reporting capabilities.
Core Capabilities:
1. Universal Data Connectivity Connect to all major marketing platforms within minutes:
- Advertising: Google Ads, Meta, LinkedIn, TikTok, Pinterest, Snapchat, Reddit, Twitter, Bing, and more
- E-commerce: Shopify, WooCommerce, BigCommerce, Magento, custom stores
- Email/SMS: Klaviyo, Mailchimp, SendGrid, Attentive, Postscript, Omnisend
- Analytics: Google Analytics 4, Adobe Analytics, Mixpanel
- CRM: Salesforce, HubSpot, Pipedrive
- Other: Affiliate platforms, webinar systems, event platforms
Each client gets 5 data sources included, with additional sources at $20/month each.
2. Custom Metrics and Calculations Create agency-specific or client-specific metrics:
- Blended ROAS calculations
- Custom attribution models
- Client-specific KPIs
- Agency performance scores
3. Pre-Built and Custom Dashboards Start with templates, customize endlessly:
- System-Defined Reports: Industry-standard reports ready out of the box
- Custom Dashboard Builder: Drag-and-drop interface for unique views
- Summary Metrics: High-level KPIs for executives
- Trend Charts: Visual performance tracking
- Client Access Control: Give clients secure access to their dashboards only
4. Automated Scheduling and Distribution Set it and forget it:
- Schedule reports to client inboxes
- Slack channel integration for real-time updates
- Automated executive summaries
- Alert notifications for anomalies
5. Marketing Calendar Integration Connect planning to execution:
- Upload marketing channel budgets
- Integrate marketing calendars
- Track actual vs. planned spend
- Budget pacing alerts
Agency-Specific Advantages:
- Multi-Client Dashboard: See all clients at once, switch seamlessly between them
- White-Label Options: Brand dashboards with your agency identity
- Client User Management: Granular control over what each stakeholder sees
- Efficient Onboarding: New client setup in under 1 hour
- Scalable Architecture: Add clients without adding infrastructure complexity
Pricing for Agencies: Axis offers tiered pricing based on client monthly ad spend:
Add-Ons:
TierMonthly PriceClient Annual Ad Budget
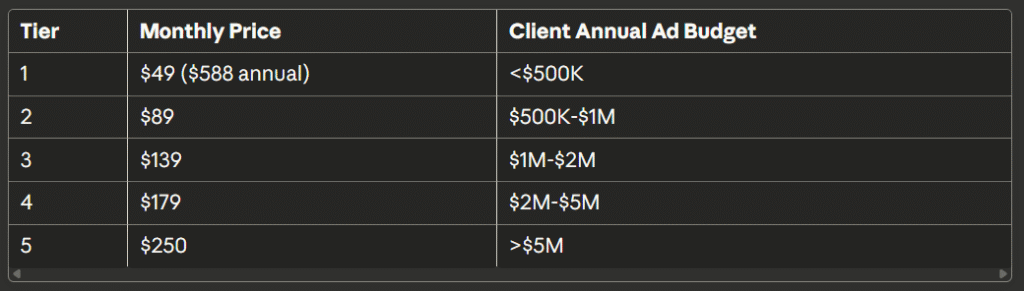
- Axis Dashboards: +50% of tier price for advanced dashboard features
- Creative Analytics: +25% of tier price for creative performance insights
- Navigator AI: +50% of tier price for AI agents and MCP server access
Cost Comparison: For a client spending $2M annually on ads:
- Traditional Stack: Supermetrics ($300) + Looker ($200 per user) + Creative tool ($300) = $800-1,500/month
- LayerFive Axis: $139-208/month (depending on add-ons)
- Savings: $592-1,292/month = $7,104-15,504 annually per client
For 10 clients, that’s $71,040-155,040 in annual savings.
LayerFive Signal: Attribution and ID Resolution
LayerFive Signal builds on Axis to provide comprehensive attribution, identity resolution, and journey analytics.
Core Capabilities:
1. LayerFive Pixel (L5 Pixel) First-party tracking infrastructure:
- Granular event tracking on websites and apps
- Cross-device visitor tracking
- Cookie-less tracking capabilities for privacy compliance
- Server-side event tracking
2. Industry-Leading ID Resolution Dramatically better visitor identification:
- 2-5X better recognition rates than TripleWhale or Northbeam
- Probabilistic and deterministic matching using AI
- Cross-device identity stitching
- Anonymous visitor scoring
Most e-commerce attribution tools recognize less than 10% of website visitors. LayerFive typically achieves 20-40% recognition rates—a game-changing improvement.
3. Multi-Touch Attribution Understand the true customer journey:
- Multiple attribution models (first-touch, last-touch, linear, time-decay, position-based)
- Custom attribution model builder
- View-through attribution modeling
- Cross-channel attribution
4. Comprehensive Analytics Suite Everything agencies need in one place:
- Web Analytics: Full Google Analytics alternative
- Funnel Analysis: Identify drop-off points
- Cohort Analysis: Track customer behavior over time
- Product Analytics: Understand product-level performance
- Customer Journey Mapping: Visualize complete paths to conversion
5. Media Mix Modeling and Incrementality Predict optimal spend allocation:
- Predictive media mix models
- Incrementality testing frameworks
- Budget optimization recommendations
- “What-if” scenario modeling
6. Halo Effect Measurement Measure indirect channel influence:
- How display advertising affects direct traffic
- Social media’s impact on branded search
- Cross-channel influence analysis
7. Conversion APIs (CAPI) Maximize ad platform performance:
- Meta CAPI implementation (20% ROAS improvement typical)
- Google enhanced conversions
- TikTok events API
- First-party data sharing with platforms
Agency Value:
For E-commerce Clients: Signal provides everything TripleWhale or Northbeam offers, plus:
- Better ID resolution (2-5X improvement)
- More comprehensive funnel analytics
- Integrated with unified reporting (Axis)
- Lower cost ($99-1,999/month vs. $299-2,499/month for competitors)
For B2B Clients: Signal excels where competitors fail:
- Company-level identification for B2B visitors
- Pipeline attribution from first touch to closed deal
- Marketing-qualified lead (MQL) tracking
- Integration with CRM for complete visibility
For SaaS Clients: Perfect for product-led growth (PLG) models:
- Free trial to paid conversion tracking
- Feature usage attribution
- Expansion revenue attribution
- Product analytics integrated with marketing data
Setup Process:
- Add L5 Pixel to client website (15 minutes)
- Enable Meta CAPI and other conversion APIs (30 minutes)
- Configure URL parameters for email/SMS tracking (15 minutes)
- Set up email/phone capture integration (15 minutes)
- Start seeing attributed data (immediate)
Total setup time: under 2 hours to full attribution.
Pricing: Based on client annual revenue/gross sales:
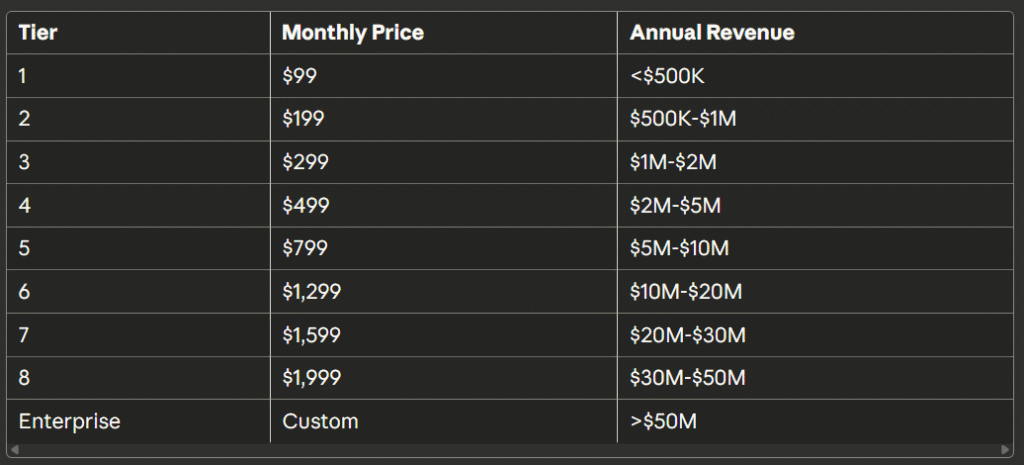
Cost Comparison: For a $5M annual revenue e-commerce client:
- TripleWhale Pro: $999-1,299/month
- Northbeam: $1,500-2,000/month
- Hyros: $999-1,499/month
- LayerFive Signal: $799/month
Plus, LayerFive includes capabilities those platforms lack (funnel analytics, journey mapping, predictive MMM).
LayerFive Edge: Visitor Intelligence and Predictive Audiences
LayerFive Edge takes attribution further by enabling 1:1 personalization and AI-powered audience segmentation.
Core Capabilities:
1. AI-Powered Visitor Scoring Every visitor gets intelligence scores:
- Purchase Propensity Score: Likelihood to convert (0-100)
- Engagement Score: Current interest level
- Product Affinity Scores: Interest in specific products/categories
- Churn Risk: Likelihood existing customer will disengage
2. Predictive Audience Building AI-generated segments based on behavior:
- High-intent visitors who haven’t purchased
- Cart abandoners (with cart contents visible)
- Re-engagement candidates (previously engaged, now cold)
- Loyal customers showing disengagement signals
- Product-specific interest audiences
3. Rule-Based Segmentation Custom audiences based on any criteria:
- Behavioral triggers (visited 3+ times, viewed specific product)
- Demographic attributes
- Purchase history
- Engagement patterns
- Custom business logic
4. Cross-Channel Activation Push audiences to any platform:
- Meta (Facebook/Instagram): Custom Audiences
- Google Ads: Customer Match lists
- Email/SMS: Klaviyo, Mailchimp, Attentive integration
- Other Platforms: Extensible integration framework
5. Dynamic Personalization Data Feed 1:1 personalization engines:
- Product recommendations per visitor
- Personalized email content
- Dynamic website experiences
- Tailored SMS messages
Real-World Application Example:
An apparel client has 10,000 website visitors monthly but only 200 convert (2% conversion rate). With LayerFive Edge:
- Identify high-intent non-converters: 1,500 visitors scored 70+ purchase propensity
- Create retargeting audience: Push to Meta and Google
- Personalized email sequence: Trigger based on product affinity scores
- Result: 8% conversion rate on retargeted audience = 120 additional conversions
At $150 average order value, that’s $18,000 in incremental monthly revenue for this single use case.
Agency Use Cases:
Inventory Movement: “I need to move inventory for winter coats—who should we target?” Edge identifies visitors who viewed winter coats, scored high on cold-weather product affinity, and haven’t purchased yet.
Re-engagement Campaigns: “Who’s gone cold in the past 3 months?” Edge automatically identifies previously engaged visitors showing disengagement signals.
Cart Abandonment: “Who abandoned cart and what’s in their cart?” Edge tracks cart abandoners with full cart contents, enabling personalized recovery campaigns.
Loyalty Reactivation: “Which loyal customers aren’t engaging anymore?” Edge identifies high-LTV customers showing decreased engagement for proactive outreach.
Product Launch Targeting: “Who’s most likely to buy our new product line?” Edge builds predictive audiences based on product affinity across catalog.
Pricing: Same tiering as Signal (based on client annual revenue):
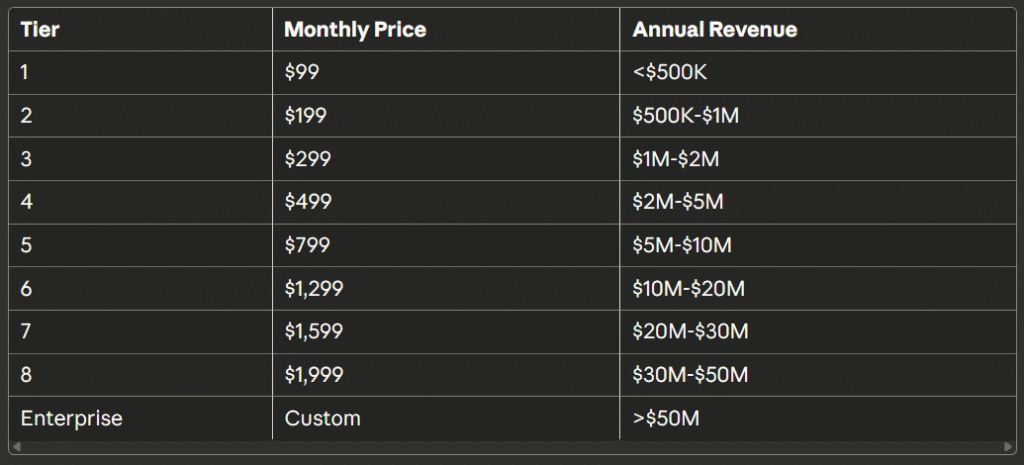
No Additional Setup Required: Edge builds on Signal’s pixel implementation—no extra technical work needed.
LayerFive Navigator: Agentic AI for Marketing
LayerFive Navigator is the AI layer across all LayerFive products, providing automated insights, natural language querying, and enterprise AI integration.
Core Capabilities:
1. Automated Insight Generation AI discovers trends before you look:
- Performance anomaly detection
- Budget pacing alerts
- Creative fatigue warnings
- Cross-client benchmarking insights
- Opportunity identification
2. Natural Language Queries Ask questions in plain English:
- “Which clients saw declining ROAS this week?”
- “Show me the best-performing creatives across all e-commerce clients”
- “What’s the average customer journey length for clients in the $2-5M revenue range?”
3. Automated Reporting and Communication AI-generated summaries and messages:
- Executive summary generation
- Client update emails (draft form, you review/send)
- Slack notifications for key events
- Presentation deck generation from data
4. Agentic Workflow Integration Connect Navigator to enterprise AI tools:
- MCP Server: Makes LayerFive data available to Claude, GPT, and other AI systems
- API Access: Build custom agentic workflows
- Integration Framework: Connect to your existing AI stack
5. Cross-Client Intelligence Agency-specific insights:
- Portfolio-level performance trends
- Client cohort analysis
- Best practice identification across accounts
- Predictive client churn scoring
Pricing:
- With Axis: $20/month add-on
- With Signal or Edge: $99/month add-on
Agency ROI: Navigator saves 5-10 hours per week in:
- Report creation time
- Insight discovery
- Client communication drafting
- Strategic analysis
At $150/hour value, that’s $3,000-6,000 monthly savings, or $36,000-72,000 annually.
The Integrated Value Proposition
When agencies use the full LayerFive suite (Axis + Signal + Edge + Navigator), the value compounds:
Data Foundation (Axis):
- Unified data from all client sources
- Custom reporting and dashboards
- Automated distribution
Attribution Intelligence (Signal):
- Know what’s actually working
- Optimize budget allocation
- Prove ROI to clients
Audience Activation (Edge):
- Convert more of existing traffic
- Personalize at scale
- Increase client revenue directly
AI Amplification (Navigator):
- Automate routine analysis
- Proactive opportunity identification
- Scale strategic insights across all clients
Agency Commission Structure: LayerFive rewards agencies for bringing clients:
- Year 1: 20% commission on all client subscriptions you bring
- Year 2: 10% commission on renewals
- Agency Tools: Free (agency dashboard, user access controls, client management)
For an agency bringing 10 clients averaging $400/month across LayerFive products:
- Monthly commission Year 1: $800
- Annual commission Year 1: $9,600
- Annual commission Year 2: $4,800
This makes consolidation not just cost-neutral but profit-positive for agencies.
<a name=”implementation-roadmap”></a>Implementation Roadmap: From Chaos to Clarity in 30 Days
Consolidating your agency’s reporting infrastructure might sound daunting, but with the right approach, you can transition smoothly without disrupting client relationships or operations.
Pre-Implementation: Planning Phase (Week 1)
Step 1: Audit Your Current State Document everything you’re currently using:
- List all tools and their costs
- Identify which clients use which platforms
- Calculate total monthly/annual tool spend
- Survey team on pain points and desires
- Document current reporting workflows
Step 2: Identify Pilot Clients Choose 2-3 clients for initial implementation:
- Good Candidates: Clients with clear data sources, moderate complexity, strong relationship
- Avoid Initially: Clients with custom integrations, hyper-complex requirements, or rocky relationships
Step 3: Set Success Metrics Define what success looks like:
- Time saved per client on reporting (target: 50-70% reduction)
- Data freshness (target: hourly updates vs. weekly manual)
- Client satisfaction scores
- Cost savings
- Accuracy/error reduction
Step 4: Team Training Plan Prepare your team for transition:
- Identify Navigator power users (1-2 team members)
- Schedule LayerFive training sessions
- Create internal documentation
- Establish support channels
Implementation: Pilot Phase (Weeks 2-3)
Week 2: First Pilot Client
Day 1-2: Data Source Connections
- Set up LayerFive Axis account
- Connect advertising platforms (Google, Meta, LinkedIn, etc.)
- Connect e-commerce platform
- Connect email/SMS tools
- Connect analytics platforms
- Verify data is flowing correctly
Day 3: Signal Setup (if including attribution)
- Implement L5 Pixel on client website
- Configure Meta CAPI
- Set up URL parameter tracking for email/SMS
- Configure conversion tracking
- Test end-to-end tracking
Day 4: Dashboard Creation
- Build initial dashboards using templates
- Customize for client-specific KPIs
- Set up scheduled reports
- Configure Slack/email notifications
Day 5: Validation and Comparison
- Run parallel reports (old system vs. LayerFive)
- Verify data accuracy
- Document any discrepancies
- Adjust configurations as needed
Week 3: Additional Pilot Clients + Refinement
Day 1-2: Client #2 Onboarding Apply learnings from Client #1:
- Faster setup (expect 4-6 hours vs. 8-10)
- Use templates created for Client #1 where applicable
- Document any new edge cases
Day 3-4: Client #3 Onboarding Continue refinement:
- Setup time should be under 4 hours now
- Build template library
- Identify standardization opportunities
Day 5: Review and Document
- Team debrief on pilot experience
- Document best practices
- Update training materials
- Refine onboarding checklist
Rollout: Full Client Base (Week 4 and ongoing)
Week 4: Phase 2 Clients (4-5 clients) With proven process, accelerate rollout:
- Group clients by similarity
- Batch similar configurations
- Leverage templates extensively
- Target 2-3 hours per client setup
Weeks 5-6: Remaining Clients Complete transition:
- Onboard 3-4 clients per week
- Maintain quality over speed
- Keep old systems running in parallel initially
Week 7-8: Sunset Legacy Systems Carefully transition away from old tools:
- Verify complete data coverage in LayerFive
- Export historical data from legacy systems
- Cancel tool subscriptions (staged approach)
- Document any exceptions
Post-Implementation: Optimization Phase (Ongoing)
Month 2: Advanced Features Expand beyond basic reporting:
- Implement Edge audiences for clients who will benefit
- Set up Navigator AI workflows
- Create advanced attribution models
- Build creative performance dashboards
Month 3: Client Education Bring clients into the platform:
- Create client-specific dashboard access
- Train client contacts on self-service reporting
- Position as value-add (transparency and insights)
Months 4-6: Continuous Improvement Optimize operations continuously:
- Regular team feedback sessions
- Client satisfaction surveys
- Feature adoption tracking
- ROI measurement and documentation
Risk Mitigation Strategies
Parallel Operation Period: Run old and new systems simultaneously for 2-4 weeks to ensure data accuracy and team confidence.
Client Communication: Be proactive and transparent:
- “We’re upgrading our analytics infrastructure to provide better insights”
- “You’ll see the same reports with better accuracy and more insights”
- “No action required on your end”
Gradual Sunset: Don’t cancel all old tools immediately:
- Keep BI tools for 1-2 months during transition
- Maintain data integration tools until confident
- Stage cancellations to reduce risk
Dedicated Support: Ensure team has help:
- LayerFive onboarding specialist assigned
- Internal champion for troubleshooting
- Documentation and FAQ repository
Success Metrics to Track
Efficiency Gains:
- Time spent on reporting per client (before vs. after)
- Time to create new client dashboards
- Number of manual data pulls per week
- Report generation time
Cost Savings:
- Total tool spend (monthly and annual)
- Cost per client for reporting infrastructure
- Personnel time savings (hours × rate)
Quality Improvements:
- Data freshness (how current are reports)
- Error rate in client reports
- Client satisfaction scores
- Number of ad-hoc data requests
Business Impact:
- Client retention rates
- New client onboarding speed
- Agency capacity (number of clients manageable)
- Revenue per team member
<a name=”roi-analysis”></a>ROI Analysis: The Financial Case for Consolidation
Let’s build the complete financial model for agency consolidation, using a typical 10-client agency as our baseline.
Baseline: Current State Costs
Scenario: Agency Managing 10 Clients
Annual Ad Spend Profile:
- 2 clients at <$500K annually
- 3 clients at $500K-$1M
- 3 clients at $1M-$2M
- 2 clients at $2M-$5M
Current Tool Stack Costs:
Data Integration:
- Supermetrics: $300/month × 10 = $3,000/month
- OR Funnel.io: $2,500/month base
- Annual: $30,000-36,000
BI/Visualization:
- Looker: $4,000/month OR
- Tableau: $1,050/month OR
- PowerBI: $250/month
- Annual: $3,000-48,000
Attribution:
- Northbeam or TripleWhale: Average $800/month per client = $8,000/month
- Annual: $96,000
Creative Analytics:
- Motion or Smartly: Average $500/month per client = $5,000/month
- Annual: $60,000
Total Current Tool Costs: $189,000-240,000 annually
Personnel Costs (current state):
- 3.75 FTE Data Analysts at $75K + 30% benefits = $365,625
- 1.25 FTE Account Managers (reporting) at $65K + 30% benefits = $105,625
- 0.575 FTE Technical Support at $85K + 30% benefits = $63,538
- Total Personnel: $534,788
Other Costs:
- Data errors and rework: $4,500
- Maintenance and technical debt: $72,000
- Opportunity cost (lost capacity revenue): $240,000
Total Current State Annual Cost: $1,040,288
Future State: With LayerFive Consolidation
LayerFive Subscription Costs:
Axis Pricing (with Creative Analytics add-on):
- 2 clients (Tier 1): $49 × 1.25 = $61.25/month each
- 3 clients (Tier 2): $89 × 1.25 = $111.25/month each
- 3 clients (Tier 3): $139 × 1.25 = $173.75/month each
- 2 clients (Tier 4): $179 × 1.25 = $223.75/month each
- Monthly: $1,309
- Annual: $15,708
Signal Pricing (8 clients who need attribution):
- 0 clients Tier 1 (for this scenario)
- 2 clients Tier 2: $199/month each
- 3 clients Tier 3: $299/month each
- 2 clients Tier 4: $499/month each
- 1 client opts out (doesn’t need attribution)
- Monthly: $2,293
- Annual: $27,516
Edge Pricing (6 clients who need audience building):
- 2 clients Tier 2: $199/month each
- 2 clients Tier 3: $299/month each
- 2 clients Tier 4: $499/month each
- Monthly: $1,994
- Annual: $23,928
Navigator Pricing (all clients):
- 2 clients with only Axis: $20/month each
- 8 clients with Signal/Edge: $99/month each
- Monthly: $832
- Annual: $9,984
Total LayerFive Annual Cost: $77,136
Less Agency Commission (Year 1 at 20%): Net Cost Year 1: $61,709
Personnel Cost Changes:
Reduced Analyst Needs:
- Previously: 3.75 FTE
- With LayerFive: 1.5 FTE (60% reduction)
- Savings: 2.25 FTE × $97,500 = $219,375
Reduced Account Manager Reporting Time:
- Previously: 1.25 FTE
- With LayerFive: 0.5 FTE (60% reduction)
- Savings: 0.75 FTE × $84,500 = $63,375
Reduced Technical Support:
- Previously: 0.575 FTE
- With LayerFive: 0.2 FTE (65% reduction)
- Savings: 0.375 FTE × $110,500 = $41,438
Total Personnel Savings: $324,188 annually
Other Cost Reductions:
- Maintenance/technical debt: Reduced by 70% = $50,400 savings
- Errors/rework: Reduced by 80% = $3,600 savings
- Gained capacity: Can now serve 2-3 more clients = $240,000 potential new revenue
ROI Calculation
Total First-Year Savings:
- Eliminated tool costs: $189,000-240,000
- Minus LayerFive net cost: -$61,709
- Tool cost savings: $127,291-178,291
- Personnel savings: $324,188
- Maintenance savings: $50,400
- Error reduction savings: $3,600
Total Hard Cost Savings: $505,479-556,479
Soft Benefits (not included in ROI but significant):
- Capacity for 2-3 additional clients: $240,000-360,000 potential revenue
- Reduced client churn (improved reporting): $60,000 value
- Faster client onboarding: 30-50 hours saved per new client
- Strategic time freed up: 80+ hours monthly
First Year ROI: 720-802%
Payback Period: 0.73 months (22 days)
Multi-Year Financial Impact
Year 1:
- Investment (net): $61,709
- Savings: $505,479
- Net Benefit: $443,770
- ROI: 720%
Year 2:
- Investment (net): $69,609 (commission drops to 10%)
- Savings: $505,479 (ongoing)
- Net Benefit: $435,870
- Cumulative Net Benefit: $879,640
Year 3:
- Investment (net): $77,136 (no commission)
- Savings: $505,479 (ongoing)
- Net Benefit: $428,343
- Cumulative Net Benefit: $1,307,983
Three-Year Total Net Benefit: $1,307,983
Breakeven Analysis: Smaller Agencies
Scenario: Agency with 3 Clients
Current State:
- Tool stack: $63,000 annually
- Personnel: 1.25 FTE analysts ($121,875) + 0.4 FTE AM ($33,800) = $155,675
- Other costs: $30,000
- Total: $248,675
LayerFive State:
- Subscriptions: $23,160
- Commission (Year 1): -$4,632
- Net cost: $18,528
- Personnel: 0.5 FTE analysts ($48,750) + 0.15 FTE AM ($12,675) = $61,425
- Other costs: $9,000
- Total: $88,953
Annual Savings: $159,722 ROI: 762%
Even at just 3 clients, consolidation delivers massive ROI.
Client-Level Value Proposition
What You Can Tell Clients:
For a typical e-commerce client doing $3M annual revenue with $500K ad spend:
Current State (what they’re getting):
- Weekly reports with 3-5 day lag
- Platform-reported metrics (often inflated)
- No true attribution insight
- Limited audience targeting
- Manual creative analysis
With LayerFive (what they’ll get):
- Daily (or real-time) dashboards with insights
- Verified attribution showing true channel performance
- 2-5X better visitor identification
- AI-powered audience targeting increasing conversions
- Automated creative performance insights
Client Impact:
- 20% improvement in marketing ROI (typical)
- $100K in incremental attributed revenue
- Better customer experience through personalization
- Strategic partner (you) freed up to focus on growth
- Transparency and trust through better data
Client Cost: Often neutral or even negative if you pass through some agency commission savings while keeping most for yourself.
Client Onboarding Excellence: Faster, Smoother, More Profitable
One of the most underappreciated benefits of consolidation is the transformation of your client onboarding process. Let’s explore how unified infrastructure changes the game.
Traditional Client Onboarding Pain
Week 1-2: Data Access and Integration
- Request access to all client marketing platforms (2-5 days for responses)
- Set up Supermetrics connections for each platform (5-8 hours)
- Configure data warehouse or BI tool (10-15 hours)
- Debug connection issues (5-10 hours)
Week 2-3: Dashboard Development
- Design custom dashboards for client KPIs (8-12 hours)
- Build calculations and custom metrics (5-8 hours)
- QA and test data accuracy (5-8 hours)
- Iterate based on client feedback (3-5 hours)
Week 3-4: Attribution Setup (if needed)
- Implement tracking pixels (3-5 hours)
- Configure conversion tracking (3-5 hours)
- Set up attribution model (5-8 hours)
- Validate data flow (3-5 hours)
Week 4-5: Training and Rollout
- Internal team training (4-6 hours)
- Client presentation and training (2-3 hours)
- Iteration on feedback (3-5 hours)
Total Traditional Onboarding:
- Timeline: 4-5 weeks
- Labor Hours: 60-90 hours
- Cost: $9,000-13,500 at $150/hour
- Revenue Delay: 4-5 weeks before billing full retainer
LayerFive Client Onboarding Process
Day 1: Setup (2 hours total)
Hour 1: Data Connections
- Create client account in LayerFive (5 minutes)
- Connect advertising platforms (30 minutes total for 5-6 platforms)
- Connect e-commerce or CRM (10 minutes)
- Connect email/analytics (15 minutes)
- Verify data flow (10 minutes)
Hour 2: Configuration
- Select or customize dashboard template (20 minutes)
- Configure client-specific KPIs (15 minutes)
- Set up reporting schedule (10 minutes)
- Configure alert thresholds (15 minutes)
Day 2-3: Advanced Setup (3-4 hours if including Signal/Edge)
Attribution (if needed):
- Implement L5 Pixel (30 minutes with tag manager)
- Configure Meta CAPI (20 minutes)
- Set up URL parameter tracking (15 minutes)
- Test conversion tracking (20 minutes)
Audience Setup (if including Edge):
- Review initial AI segmentation (15 minutes)
- Configure rule-based segments (30 minutes)
- Set up activation destinations (20 minutes)
Day 4: Client Presentation (1-2 hours)
- Internal review of dashboards (30 minutes)
- Client walkthrough and training (60-90 minutes)
- Gather feedback and adjust (30 minutes)
Total LayerFive Onboarding:
- Timeline: 3-4 days
- Labor Hours: 6-10 hours
- Cost: $900-1,500 at $150/hour
- Revenue Delay: Less than 1 week
Improvement:
- 85-88% faster (4-5 weeks → 3-4 days)
- 85% less labor (60-90 hours → 6-10 hours)
- $7,500-12,000 saved per client
Standardization Advantages
Template Library Development: As you onboard more clients, you build a library of templates:
By Industry:
- E-commerce (Shopify, WooCommerce, BigCommerce variants)
- B2B SaaS (PLG focus, SLG focus, hybrid)
- B2B Services (lead generation, pipeline focus)
- B2C Services (appointment-based, subscription, one-time)
By Client Size:
- Small (<$1M revenue): Focus on core metrics and efficiency
- Medium ($1M-$10M): Add strategic depth and cohort analysis
- Large (>$10M): Comprehensive multi-channel, multi-product analytics
By Maturity Stage:
- Early stage: Establish baseline, simple dashboards
- Growth stage: Attribution, optimization focus
- Scaling stage: Advanced segmentation, predictive analytics
Template Benefits:
- First client in a category: 8-10 hours setup
- Second client in same category: 4-5 hours (50% reduction)
- Fifth client in same category: 2-3 hours (70% reduction)
Compounding Returns: As your template library grows:
- Year 1: Average 7 hours per new client
- Year 2: Average 4 hours per new client (43% improvement)
- Year 3: Average 2.5 hours per new client (64% improvement from Year 1)
Onboarding as Competitive Advantage
Speed to Value: Show client results in first week:
- “Here’s your current performance baseline”
- “These are the channels driving actual conversions”
- “We’ve identified $X in wasted ad spend”
- “Here’s your first optimization recommendation”
This creates immediate confidence and differentiates from competitors who need 4-6 weeks for first insights.
Professional Polish: LayerFive dashboards look sophisticated immediately:
- Beautiful visualizations
- Professional layouts
- Real-time data
- Mobile-responsive
Compare to competitors showing spreadsheets or clunky dashboards for weeks during setup.
Scalability Signal: Fast onboarding signals operational maturity:
- “We’ve done this many times”
- “We have systems and processes”
- “You’re in good hands”
Slow, painful onboarding signals:
- “We’re figuring this out as we go”
- “Hope this works out”
- “You might be our testing ground”
Financial Impact of Faster Onboarding
Revenue Acceleration: For agency with average $8,000 monthly retainer:
- Traditional onboarding: 4-5 weeks delay = $8,000-10,000 revenue delay
- LayerFive onboarding: <1 week = ~$2,000 revenue delay
- Gain per client: $6,000-8,000 faster cash collection
Capacity Improvement: With 85% less onboarding time:
- Traditional: Can onboard 2-3 new clients monthly with dedicated onboarding specialist
- LayerFive: Can onboard 8-12 new clients monthly with same resource
- 4X capacity increase
Client Satisfaction: Faster time-to-value improves early-stage retention:
- Clients who see value in Week 1 are 60% more likely to extend past 90 days
- Clients waiting 4-5 weeks are already questioning the relationship
New Client Acquisition: Word-of-mouth referrals increase when onboarding is smooth:
- “They had us up and running in days, not weeks”
- “Most professional onboarding I’ve experienced”
- “They clearly know what they’re doing”
Advanced Use Cases: Beyond Basic Reporting
Once you have unified infrastructure in place, capabilities expand far beyond basic reporting. Here are advanced use cases that transform agency operations.
Portfolio Intelligence
Cross-Client Benchmarking: With all client data unified:
- “E-commerce clients in $2-5M range average 3.2x ROAS on Meta”
- “Your ROAS is 2.1x—opportunity for 52% improvement”
- “Top performers in your category see 45% of revenue from email”
Best Practice Identification: Identify what works across your portfolio:
- “Clients using video ads see 34% higher ROAS than static”
- “Carousel ads outperform single image by 28% for product categories with >10 SKUs”
- “Branded search conversion rates average 8.2%, yours is 5.1%”
Agency Health Metrics: Monitor your business holistically:
- Aggregate revenue trends across all clients
- Client performance distribution (which clients are thriving vs. struggling)
- Portfolio-level ROAS trends
- Churn risk scoring based on performance degradation
Predictive Client Churn Prevention
Early Warning Signals: LayerFive data reveals churn risk before clients tell you:
- Performance declining for 2+ consecutive months
- Budget utilization dropping
- Dashboard login frequency decreasing
- Inquiry volume declining
Proactive Intervention: When signals appear, take action:
- Navigator alerts you to the pattern
- Prepare analysis showing external factors (market conditions, seasonality)
- Schedule proactive strategy session
- Present optimization recommendations
- Demonstrate your value before they question it
Impact: Reducing churn from 20% to 15% for $1.2M revenue agency = $60,000 annual value.
Automated Client Communication
Weekly Automated Summaries: Navigator generates client-ready reports:
- Performance highlights vs. previous week
- Anomaly explanations
- Optimization recommendations
- Next week’s focus areas
You review and send (5 minutes vs. 1-2 hours writing from scratch).
Monthly Strategic Reviews: Navigator creates comprehensive monthly reports:
- Performance trends with context
- Competitive positioning insights
- Strategic recommendations
- Success stories and wins
You enhance with strategic perspective (30 minutes vs. 4-6 hours).
Alert-Driven Communication: Navigator notifies you of important events:
- “Client X: Google Ads ROAS jumped 45% due to Shopping campaign optimization” → Immediately email client celebrating the win
- “Client Y: Meta performance dropped 22%, likely due to creative fatigue” → Proactively schedule creative refresh discussion
Competitive Intelligence
Cross-Client Creative Analysis: Aggregate creative performance data:
- Most effective creative formats by industry
- Messaging themes that resonate
- Visual elements that drive engagement
- Creative fatigue timelines by platform
Market Trend Detection: Spot market shifts early:
- “iOS users converting 30% less across all clients—attribution impact”
- “Video ads seeing 40% ROAS improvement across portfolio last 60 days”
- “TikTok ROAS improving rapidly—worth testing for more clients”
White-Label Client Portals
Self-Service Client Access: Give clients direct dashboard access:
- Branded with your agency identity
- Client sees only their data
- Real-time performance monitoring
- Reduces “how are we doing?” inquiries
Client Education: Sophisticated clients appreciate transparency:
- “See exactly how we’re managing your budget”
- “Understand channel attribution in real-time”
- “See your customer journey insights”
Trust Building: Transparency builds confidence:
- Nothing to hide
- Data-driven decisions
- Professional infrastructure
Agency-Specific Automation Workflows
Budget Alerts:
- “Client X: On track to underspend budget by 22% this month—recommend increasing Facebook spend”
- “Client Y: Pacing to overspend by $3,500—recommend pausing underperforming campaigns”
Performance Anomaly Escalation:
- “Critical: Client Z’s conversion rate dropped 55% today—investigating”
- Automatically generates hypothesis list
- Prioritizes investigation tasks
Optimization Opportunity Identification:
- “Client A: Shopping campaigns ROAS 4.2x vs. Search 2.1x—recommend budget reallocation”
- Calculates potential revenue impact
- Drafts client recommendation
Attribution Model Experimentation
Custom Attribution Models: Build agency-specific models:
- “Agency standard: 40% first-touch, 60% last-touch with 30-day window”
- Compare against platform models
- Validate with incrementality testing
Client-Specific Tuning: Optimize models per client:
- Short sales cycle clients: 7-14 day window
- Long sales cycle clients: 60-90 day window
- Different models for different product categories
Incrementality Testing Framework
Systematic Testing: Prove channel value:
- Geo-holdout tests for brand advertising
- On/off testing for individual channels
- Budget shift testing
Portfolio-Level Learning: Test once, apply broadly:
- “Brand display shows 15% incremental lift across e-commerce portfolio”
- Roll out to all relevant clients
- Amortize testing cost across portfolio
Competitive Advantages: What Sets Modern Agencies Apart
Agencies that consolidate their reporting infrastructure gain multiple competitive advantages in the marketplace.
Advantage 1: Operational Excellence
Scalability: Traditional agencies hit scaling walls:
- Each new client adds operational complexity
- Data analysts become bottleneck
- Quality suffers as team stretches
Consolidated agencies scale smoothly:
- Standard onboarding process
- Minimal incremental operational overhead
- Quality remains consistent
- Team focuses on strategy, not data wrangling
Result: Can serve 2-3X more clients with same team size.
Advantage 2: Strategic Positioning
From Order-Takers to Strategic Partners: Without consolidation:
- Time spent on reporting → tactical role
- React to client requests
- Defend performance when questioned
With consolidation:
- Time freed for strategy → strategic partner role
- Proactively identify opportunities
- Lead with insights and recommendations
Result: Higher retainers, longer relationships, more referrals.
Advantage 3: Superior Client Results
Better Attribution → Better Optimization: LayerFive’s 2-5X better visitor identification means:
- More accurate attribution
- Better understanding of customer journey
- Smarter budget allocation
- Higher client ROAS
Real Example: Billy Footwear (LayerFive Client)
- Result: 72% revenue increase
- Ad Spend Increase: Only 7%
- How: Better attribution revealed underinvested channels
Result: Your clients grow faster, stay longer, refer more.
Advantage 4: Data-Driven Culture
Agency-Wide Intelligence: Unified data enables:
- Portfolio-level insights
- Best practice sharing across team
- Continuous learning culture
- Data-informed hiring and training
Team Development: Analysts become strategists:
- Less time on data plumbing
- More time on analysis and recommendations
- Higher job satisfaction
- Better talent retention
Result: Stronger team, better culture, lower turnover.
Advantage 5: New Service Offerings
Advanced Services Enabled: With infrastructure in place:
- Attribution consulting
- Audience strategy and segmentation
- Creative performance optimization
- Marketing mix modeling
- Incrementality testing
These command premium fees and differentiate from basic agency services.
Expanded Market Opportunities: Serve clients you couldn’t before:
- Complex multi-channel campaigns
- Large e-commerce brands
- Sophisticated SaaS companies
- Clients with custom requirements
Result: Move upmarket, increase ACV, improve margins.
Advantage 6: Technology Partnership Differentiation
Modern Infrastructure Signals: Using LayerFive positions you as:
- Technology-forward agency
- Investment in best-in-class tools
- Operational maturity
- Future-ready organization
Contrast with competitors showing:
- Spreadsheets
- Manual processes
- Fragmented tool stacks
- “We’ll figure it out” approach
Result: Win competitive pitches, command premium pricing.
Advantage 7: Economic Resilience
Lower Fixed Costs: Consolidated infrastructure means:
- Less tool spend per client
- Smaller team needed for operations
- Better margins per client
More Flexible Scaling: Can scale up or down more easily:
- Add clients without adding infrastructure
- Reduce clients without stranded costs
- Weather market fluctuations better
Result: More profitable, more resilient business.
Getting Started: Your First Steps Toward Consolidation
Ready to transform your agency operations? Here’s how to begin.
Step 1: Assess Your Current State
Complete the Agency Reporting Audit: Answer these questions:
- How many clients do you currently serve?
- What’s your average monthly retainer per client?
- List all data/reporting tools you currently pay for
- How much do you spend monthly on these tools?
- How many FTE hours go into reporting weekly?
- How long does new client onboarding take?
- What’s your current annual client churn rate?
- Do you currently offer attribution services?
- What client complaints do you receive about reporting?
- What opportunities are you missing due to capacity constraints?
Step 2: Calculate Your Potential ROI
Use This Framework:
- Current tool costs: $______/month
- Current personnel costs (reporting): $______/month
- Number of clients: _____
- Average onboarding time: _____ hours
Estimated LayerFive Cost:
- Use pricing tables earlier in this article
- Calculate based on your client revenue profile
- Include Axis + Signal + Edge for relevant clients
- Add Navigator for AI capabilities
- Subtract Year 1 commission (20%)
Estimated Savings:
- Tool cost reduction: $______/month
- Personnel time savings: _____ hours/month = $______
- Faster onboarding value: $______/year
- Capacity gain value: $______/year
Your Projected ROI: ______%
If your ROI is above 300%, consolidation is a no-brainer. If your ROI is 100-300%, consolidation makes strong strategic sense. If your ROI is below 100%, your current scale may be too small (under 3 clients) or your baseline is already highly optimized.
Step 3: Schedule LayerFive Demo
Book a Personalized Demo: Visit LayerFive or email info@layerfive.com
Prepare for Demo: Bring your audit data and specific questions:
- “We have clients using X, Y, Z platforms—how do integrations work?”
- “Our clients ask for A, B, C insights—can LayerFive provide these?”
- “We currently use [competitor]—how does LayerFive compare?”
- “Show me the agency dashboard for managing multiple clients”
During Demo: Focus on:
- Ease of setup and onboarding
- Quality and flexibility of dashboards
- Attribution capabilities if relevant
- Agency-specific features
- Support and training resources
Step 4: Pilot with 2-3 Clients
Select Pilot Clients: Choose wisely:
- Good Pilots: Strong relationship, standard tech stack, open to improvement
- Avoid: Rocky relationships, highly custom requirements, skeptical decision-makers
Set Pilot Success Criteria:
- Time savings target: 50%+ reduction in reporting hours
- Data quality: Accuracy equal or better than current state
- Client satisfaction: Positive feedback on new dashboards
- Team adoption: Team prefers LayerFive over old tools
Pilot Duration:
- Week 1: Setup and configuration
- Weeks 2-4: Parallel operation with old tools
- Week 5: Team and client feedback
- Week 6: Decision to expand or iterate
Step 5: Create Rollout Plan
Based on Pilot Success:
- Timeline for rolling out to remaining clients
- Internal training plan
- Client communication strategy
- Legacy tool sunset schedule
Resource Allocation:
- Who owns the rollout? (Project Manager)
- Who handles technical setup? (Analytics Lead)
- Who manages client communication? (Account Directors)
- What’s the support escalation path?
Step 6: Execute and Optimize
Maintain Momentum:
- Stick to rollout timeline
- Celebrate quick wins
- Address issues quickly
- Document learnings
Measure Success:
- Track all metrics defined earlier
- Survey team regularly
- Gather client feedback
- Document cost savings
Continuous Improvement:
- Monthly optimization reviews
- Feature adoption tracking
- Template library expansion
- Best practice documentation
Common Objections and Responses
“Our clients are too unique for a standardized platform” LayerFive is highly customizable. The platform provides structure while allowing flexibility for client-specific requirements. Most “unique” requirements are actually common patterns.
“Switching sounds disruptive to client relationships” Clients see improvements, not disruption. Better, faster reporting with more insights strengthens relationships. Use pilot clients to prove this before full rollout.
“We’ve invested a lot in our current stack” Sunk cost fallacy. Your investment isn’t recovering lost time and money—it’s actually costing you more each month. Calculate forward-looking ROI, not backward-looking cost.
“What if LayerFive doesn’t have a connector we need?” LayerFive has 100+ connectors and regularly adds more. For custom requirements, API access enables custom integrations. Most “must-have” connectors are already available.
“Our team is comfortable with current tools” Change is uncomfortable, but continuing with inefficient tools is more painful long-term. Involve team in decision, provide training, run pilots. Most teams prefer LayerFive after trying it.
“Pricing seems too good to be true” LayerFive achieves lower pricing through modern architecture, efficient operations, and agency focus. Traditional tools were built for single companies, carry legacy tech debt, and charge accordingly. LayerFive built for 2024, not 2014.
Conclusion: The Future of Agency Operations
The marketing agency landscape is evolving rapidly. Agencies stuck with fragmented, outdated reporting infrastructure will struggle to compete against more operationally excellent firms.
Consolidation isn’t just about cost savings—though $500K+ annually is compelling. It’s about:
- Scalability: Serving more clients without breaking your operations
- Quality: Delivering better insights and recommendations
- Speed: Responding to client needs in hours, not days
- Strategic focus: Spending time on what matters, not data wrangling
- Competitive positioning: Differentiating through operational excellence
- Profitability: Better margins through efficiency and higher-value services
The question isn’t whether to consolidate, but when.
Early adopters gain compounding advantages:
- Template libraries build over time
- Team expertise deepens
- Client satisfaction improves
- Referrals increase
- Margins expand
Agencies that wait face:
- Increasing competitive disadvantage
- Rising operational costs
- Scaling constraints
- Talent retention challenges
- Client satisfaction issues
Start your consolidation journey today.
Visit LayerFive.com to learn more, schedule a demo, and join forward-thinking agencies transforming their operations.
Your future agency—more profitable, more scalable, more strategic—is just one decision away.
Additional Resources
LayerFive Product Pages:
- Axis – Unified Marketing Data and Reporting
- Signal – Attribution and ID Resolution
- Edge – Visitor Intelligence and Predictive Audiences
- Navigator – Agentic AI for Marketing
Contact:
- Email: info@layerfive.com
- Website: https://www.layerfive.com
Schedule a Demo: See LayerFive in action with a personalized demo tailored to your agency’s specific needs and client portfolio.
Click Here: https://meetings.hubspot.com/sushil10
About LayerFive: LayerFive is a unified marketing data platform built specifically for agencies and brands managing complex, multi-channel marketing operations. With industry-leading attribution, visitor intelligence, and AI-powered insights, LayerFive helps agencies consolidate their tech stacks, improve operational efficiency, and deliver superior results to clients. Trusted by forward-thinking agencies managing 5-50+ clients, LayerFive combines enterprise-grade capabilities with agency-friendly pricing and features.