Quick answer
Shopify marketing analytics works best when store orders, ad spend, email revenue, and site behavior sit in one reporting layer instead of five browser tabs. LayerFive Axis connects those sources into custom dashboards and automated reports, so you read one set of numbers instead of reconciling Meta, Google, Klaviyo, and Shopify by hand. Add Signal for first-party attribution and you can move budget based on evidence.
TL;DR
Shopify merchants now operate at enormous scale, with $119.1 billion in platform GMV in Q3 2026 alone, yet most marketing teams still cannot agree on which channel earned a sale. Each ad platform grades its own work, and the IAB reports that 60% to 75% of senior marketers say their measurement falls short.
Takeaways from this guide:
- Measurement is the bottleneck. 78% of decision-makers believe at least 10% of their spend is wasted because measurement is weak (Haus, via eMarketer, 2026).
- Budgets are flat at 7.8% of revenue (Gartner, 2026), so efficiency has to come from better decisions.
- A unified layer such as LayerFive Axis replaces tab-hopping with shared dashboards and automated reports.
- Signal adds first-party attribution and Juno adds an AI layer that answers questions in plain language.
- Billy Footwear grew revenue 36% on only 7% more ad spend after unifying its data.
Read on for the 2026 numbers, the root causes, a five-step setup, and ten answered questions.
What is Shopify marketing analytics and why does it get messy?
Shopify marketing analytics connects store orders to the ads, emails, and site visits that produced them. It gets messy because each platform reports its own version of a sale. Shopify counts orders, Meta and Google count conversions, and Klaviyo counts attributed revenue. Add those figures together and the total often exceeds real revenue, so teams spend the week reconciling numbers instead of deciding where the next dollar goes.
Scale makes the problem worse. According to Shopify’s Q3 2026 Form 10-Q, merchants moved $119.1 billion in GMV during the quarter, up 29% year over year, and $335.5 billion across the first nine months of 2026. More volume means more brands bidding on the same audiences, and every one of them needs to know which spend actually works.
Money is tight while that happens. Gartner’s 2026 CMO Spend Survey of 401 marketing leaders found budgets flat at 7.8% of company revenue. If the budget cannot grow, the only lever left is spending the same dollars better.
Picture a Monday review. Meta says it drove last week’s sales. Google says it did. Klaviyo says it did too. Shopify shows a revenue total that cannot satisfy all three claims. Nobody is lying, and that is the uncomfortable part. Each tool measures what it can see and counts every sale it touched.
Ecommerce marketing analytics exists to resolve that argument with one agreed set of numbers. A Shopify analytics dashboard is only useful if the marketing team and the finance team trust the same figures.
The 2026 measurement gap in numbers
Marketing measurement is failing most teams in 2026. The IAB’s State of Data 2026 report found that 60% to 75% of senior buy-side marketers say their measurement methods fall short on rigor, timeliness, or trust. A Haus survey reported by eMarketer found that 78% of decision-makers believe at least 10% of spend is wasted because measurement is insufficient, and 7% put the waste at 30% or more.
The same IAB research estimates that AI-driven improvements to measurement could unlock $32 billion in media value within one to two years. That figure tells you how much value is currently trapped by poor data, not just how much AI can recover.
Confidence at the top is thin. A Haus survey covered by Demand Gen Report in April 2026 found that only 50% of marketing leaders can explain marketing ROI to their board. A March 2026 survey of 210 senior marketing leaders, reported by Advanced Television in May 2026, found that 80% optimize campaigns without verified purchase data.
Marketers also sense the leak without being able to size it. Smartly’s 2026 digital advertising trends research reports that respondents estimate roughly 20% of annual digital spend is wasted.
Platform self-reporting inflates the picture further. In a 2026 audit of 240 client accounts, agency Visionary Marketing found ad platforms claimed more conversions than backend records confirmed: 18% more for Google Ads, 24% more for Meta, and 31% more for LinkedIn. It is a small, agency-run sample, so treat it as directional. The direction still matches what practitioners see daily.
Then there is AI. Gartner’s 2026 CMO Spend Survey found CMOs allocating 15.3% of marketing budgets to AI initiatives, yet only 30% say their organizations are ready to scale AI. AI built on messy, disconnected data amplifies the mess.
Why Shopify analytics reporting keeps fragmenting
Shopify reporting fragments because the data lives in tools built for different jobs. Shopify records orders, ad platforms record clicks and views, email platforms record opens and revenue claims, and Google Analytics records sessions. None of them share a customer identity or a common attribution rule. Without a layer that joins them, every report is a manual stitch job that is out of date by the time it ships.
Three root causes sit underneath the fragmentation.
First, platforms optimize for their own attribution. Each ad network credits itself using its own windows and rules, which is why the over-claim numbers above are systematic rather than random. We cover the mechanics in how ad platforms mislead you.
Second, native tools see only their own corner. Shopify’s built-in reports describe the store well, but they were not designed to reconcile spend and conversions from every ad network. The limits of Shopify analytics show up fastest once a brand runs more than two paid channels.
Third, reporting is manual. Someone exports CSVs from five tools, pastes them into a spreadsheet, and rebuilds the same deck every week. Agencies feel this most, because the work multiplies by the number of clients. Our guide to unified client dashboards for marketing agencies shows what that overhead costs.
Identity is the quiet fourth cause. If a shopper clicks a Meta ad on a phone and buys on a laptop after a Klaviyo email, three systems each see a different visitor. The attribution gap on Shopify starts exactly there.
What most teams get wrong about Shopify analytics tools
Most teams assume one more dashboard will fix a data problem. It will not, because a dashboard only displays what it receives. If the inputs disagree, a nicer view still disagrees. The fix sits upstream, in how data is joined and which revenue number counts as the source of truth. Three other beliefs cause damage as well, and each one is worth checking against your own setup.
Three other beliefs cause damage.
“Last-click is good enough.” Marketers already know better. A 2026 survey of 2,400 marketers by Visionary Marketing found that 78% distrust last-click attribution, yet only 19% have moved to marketing mix modeling. Distrust without a replacement leaves teams stuck with numbers they do not believe.
“Platform ROAS is the truth.” A January 2026 survey of 500 senior US decision-makers, reported by eMarketer and summarized by Digital Applied, found that 60% trust independent incrementality testing most, compared with 37% who trust in-platform reporting. Buyers have already voted against self-reported results.
“Attribution is for big spenders.” Small and mid-size Shopify brands feel wasted spend more sharply, because they have less room to absorb it. The counterargument deserves respect: native Shopify analytics is genuinely enough for a store running one or two channels. Once spend spreads across Meta, Google, TikTok, and email, it stops being enough.
The honest summary is that tools rarely fail on features. They fail on trust, because nobody can explain why two reports disagree.
How LayerFive Axis simplifies Shopify marketing analytics and reporting
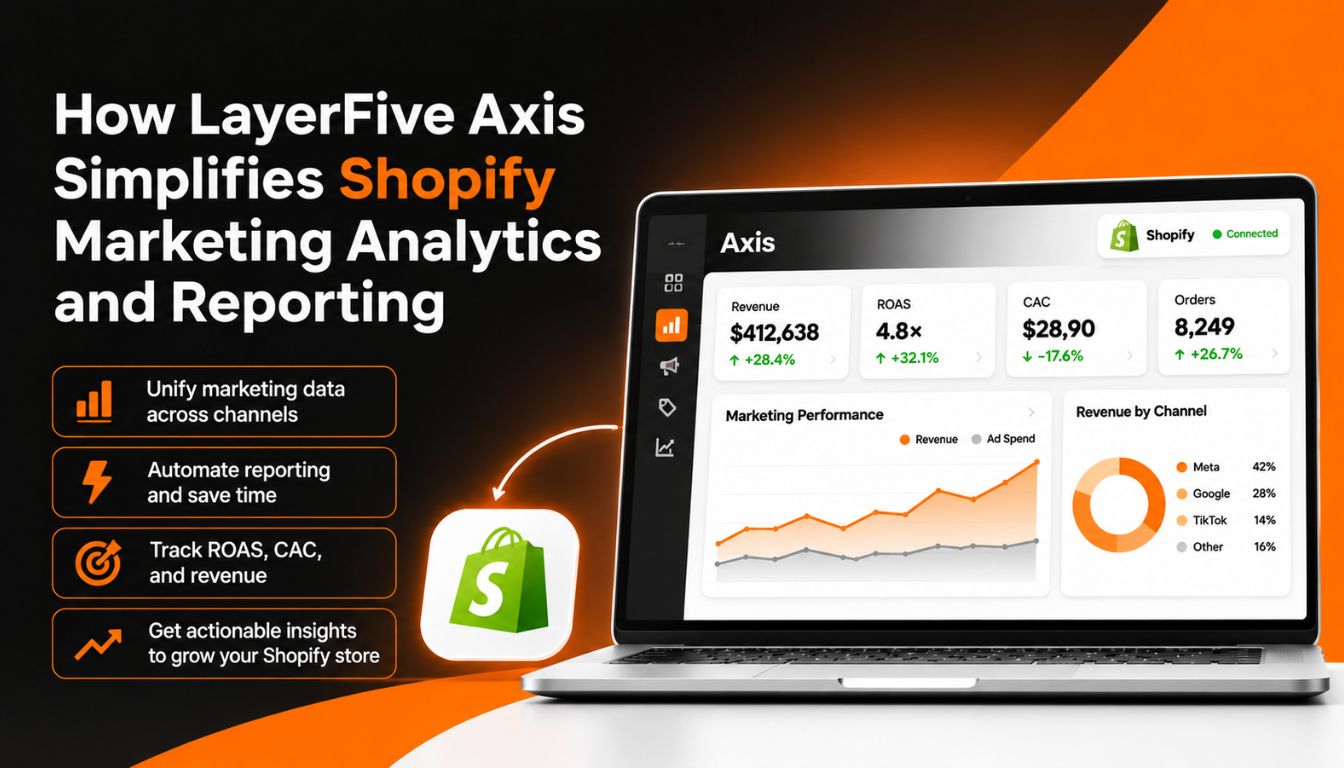
LayerFive Axis simplifies Shopify marketing analytics by pulling store, ad, email, and support data into one workspace with shared dashboards. Instead of exporting from each platform, you connect sources once and build dashboards around the decisions you make weekly. Reports then refresh on their own, so the team spends time acting on numbers rather than assembling them. The result is fewer disputes about whose numbers are right.
Axis is LayerFive’s reporting product. According to its Shopify App Store listing, it connects Shopify with Meta, Google, TikTok, Klaviyo, Yotpo, and Gorgias, and it supports unlimited data integrations, custom dashboards, creative analytics, AI insights and tasks, task-to-performance tracking, and role-based access control. A free plan lets a team connect sources and build dashboards before committing.
What changes in daily work is easy to describe. The performance marketer opens one view of spend and revenue by channel. The creative lead sees which ads drive purchases rather than clicks. The founder gets a weekly summary without asking anyone to build it. AI insights flag changes and turn them into tasks that can be tracked against performance afterward.
Agencies get a different benefit. One workspace per client, with permission levels, replaces a folder of spreadsheets. Our write-up on the multi-client reporting platform in Axis walks through the setup.
Cost matters too. LayerFive reports that traditional analytics stacks run $200K to $850K a year, while LayerFive starts at $49 a month, and that brands save $100K to $300K annually by consolidating tools. The platform is ISO 27001 and SOC 2 Type 2 certified, which matters when you are connecting customer and revenue data.
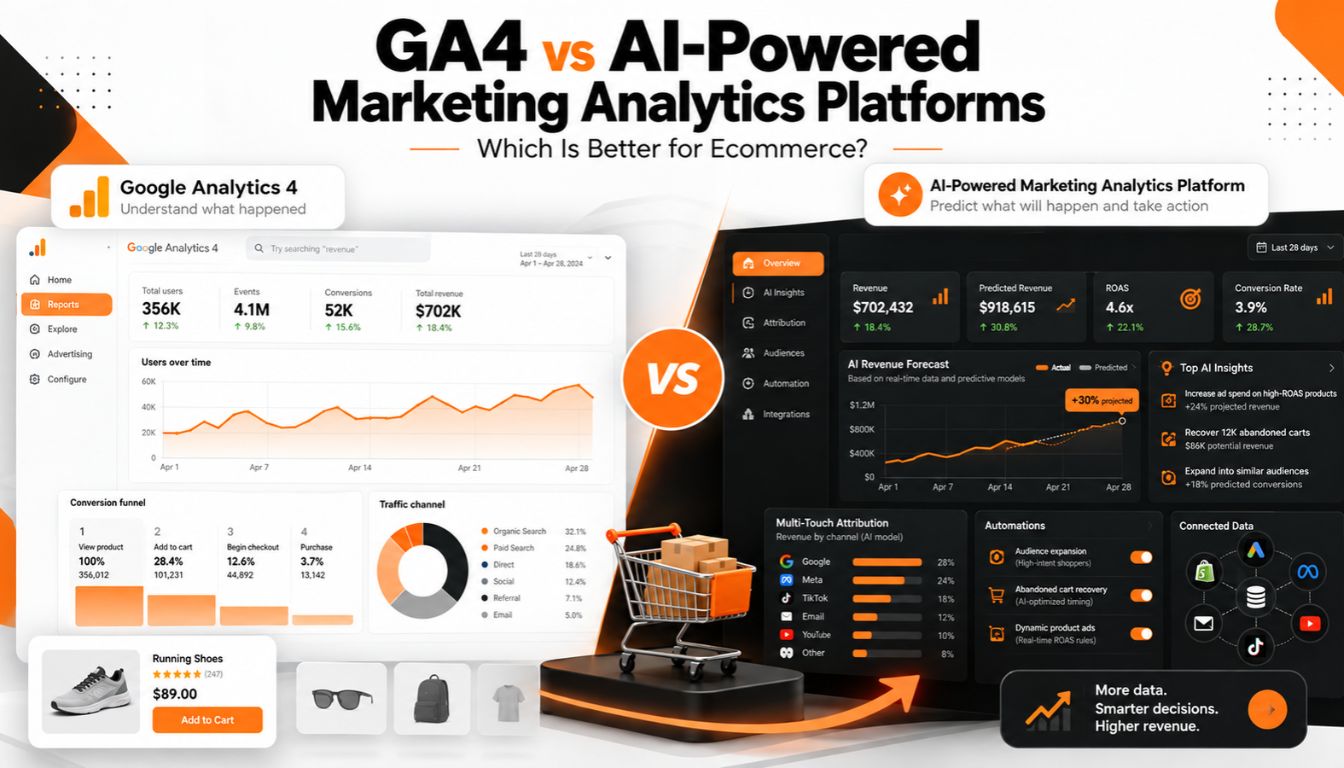
For teams currently weighing Google’s free tool, the comparison in GA4 vs LayerFive Axis lays out where each fits.
Where Signal and Juno fit alongside Axis
Axis shows what happened across channels. Signal and Juno add two more answers. Signal resolves visitor identity so more of your traffic is recognized and attributed to the right source. Juno is LayerFive’s agentic AI layer, which lets you ask questions of your unified data in plain language. You can start with Axis alone and add either later. Each product works on its own and shares the same data.
Signal handles the identity problem described earlier. When a shopper moves across devices and channels, first-party identity resolution links those touches to one person, so attribution reflects the real journey. LayerFive reports that Signal identifies 2 to 5 times more visitors than the 5% to 15% industry standard. More recognized visitors means larger retargeting audiences and fewer orders credited to “direct”. Our deeper explainer on multi-touch attribution for Shopify shows how that credit gets distributed.
Juno sits on top of the same data. Because it reads from one governed layer instead of five disconnected exports, its answers rest on the same revenue numbers your dashboards show. That consistency is what Gartner’s finding points to: AI ambition outruns readiness when the data underneath is fragmented.
None of this requires a rip-and-replace project. Teams typically connect sources in Axis first, confirm the numbers match Shopify orders, and then decide whether attribution or AI questions are the next pain point.
How Axis compares with other Shopify analytics tools
Shopify analytics tools fall into a few groups. GA4 is free and strong on site behavior. Supermetrics moves data into spreadsheets and warehouses. Triple Whale and Northbeam are ecommerce attribution dashboards, and Hyros focuses on ad tracking. LayerFive Axis differs by pairing reporting with identity resolution and AI in one platform, so reporting and attribution use the same underlying data.
Each option has a fair use case. GA4 works well for session-level behavior on the site, though it was not built to reconcile ad spend and store profit across channels. Supermetrics is useful if you have analysts who want to build their own models, since it delivers the data and leaves the reporting design to you. Triple Whale and Northbeam are built around ecommerce attribution and are common choices for brands that live in paid social. Hyros concentrates on tracking paid acquisition.
The honest trade-off is scope. A specialist attribution tool can go deep on one question. A unified platform trades some of that depth for a single source of truth that marketing, finance, and agencies can all read. If your main pain is reporting overhead and conflicting numbers across channels, unification usually pays back faster. If you already have an analytics team and a warehouse, a connector tool may be enough.
Brands choosing between options can start with our roundups of the best ecommerce analytics platform for Shopify brands and the marketing analytics tool for Shopify, Meta, Google Ads, and Klaviyo.
How to set up Shopify marketing reporting in five steps
A workable Shopify reporting setup takes five steps: pick a source of truth for revenue, connect every channel to one workspace, build one dashboard per recurring decision, automate the reports each role needs, and compare platform claims against first-party data every week. Most teams finish the first three steps in a single afternoon, and the last two become routine within a month of use.
- Choose Shopify orders as the revenue source of truth. Every other number gets checked against it.
- Connect Shopify, Meta, Google, TikTok, and Klaviyo to Axis so spend, clicks, and revenue land in one place.
- Build one dashboard per decision: daily pacing for the media buyer, weekly channel review for the growth lead, and a monthly view for the executive team.
- Schedule automated reports by role, so each person receives only the metrics they act on.
- Each week, compare what the ad platforms claim against first-party attribution from Signal, and shift budget toward the channels that hold up.
Two habits keep the system honest. Reconcile totals against Shopify before trusting any new dashboard, and write down the attribution window you use so numbers stay comparable month to month. For a broader view of how this fits a modern stack, see our guide to the marketing data platform for Shopify.
What a unified reporting layer delivered for Billy Footwear
Billy Footwear is the clearest proof point for unified Shopify marketing analytics. After connecting its marketing data in LayerFive, the brand grew revenue 36% with only 7% additional ad spend. The gain came from seeing which spend produced purchases and moving budget toward it, not from spending dramatically more. That is the practical meaning of efficiency when budgets stay flat and every dollar must earn its place.
The pattern behind that result is worth noticing. Revenue grew five times faster than spend because decisions were made on joined-up numbers. Teams that rely on platform-reported ROAS tend to keep funding campaigns that claim credit for sales that would have happened anyway. Teams that reconcile spend against first-party revenue cut those campaigns and fund the ones that add orders.
That is the practical meaning of efficiency in a flat-budget year. As Gartner’s 2026 data shows, most marketing leaders are not getting a bigger budget. They are being asked to grow with what they have. Better measurement is the cheapest source of growth available, because it costs less than another round of ad spend. For a related look at where budgets leak, read why Shopify brands waste so much of their marketing budget.
Frequently asked questions
These ten questions cover what marketers ask most about Shopify marketing analytics, dashboards, and reporting. Each answer stands on its own, so you can read only the ones you need. They span definitions, tool choices, setup, attribution, cost, security, and where LayerFive Axis, Signal, and Juno fit in a Shopify reporting workflow, with direct answers and no hedging. Skim the headings and jump to the one you need.
What is Shopify marketing analytics?
Shopify marketing analytics is the practice of connecting store orders to the ads, emails, and site visits that produced them. It combines Shopify sales data with spend and conversion data from Meta, Google, TikTok, and email tools. The goal is one agreed view of which channels earn revenue and which only claim credit, so budget decisions rest on shared numbers instead of platform self-reporting.
Why do my Shopify, Meta, and Google numbers never match?
Each platform counts conversions using its own attribution window and its own view of the customer. Shopify counts actual orders, while Meta, Google, and Klaviyo each credit themselves for sales they touched. Their totals overlap, so adding them exceeds real revenue. A unified layer such as LayerFive Axis reconciles every platform against Shopify orders, which gives you one defensible revenue figure. Expect small gaps even then.
What is the best Shopify analytics dashboard for marketing teams?
The best Shopify analytics dashboard joins store revenue with ad spend and email performance in one view. LayerFive Axis does this with custom dashboards connected to Shopify, Meta, Google, TikTok, and Klaviyo, plus role-based access for each team member. Choose based on whether you need reporting only, or reporting combined with first-party attribution and an AI layer that answers questions in plain language.
How does LayerFive Axis improve Shopify marketing reporting?
LayerFive Axis improves Shopify marketing reporting by connecting your sources once and refreshing dashboards automatically. Teams stop exporting spreadsheets and rebuilding weekly decks by hand. Role-based access gives each person only the metrics they act on, and AI insights turn changes in performance into tasks that can be tracked against results afterward, so reporting leads directly to action. That shortens the path from insight to action.
Is GA4 enough for Shopify marketing analytics?
GA4 is enough for basic site behavior, such as sessions and funnel steps, and it costs nothing. It is less suited to reconciling ad spend, email revenue, and store profit across several channels. Brands running Meta, Google, TikTok, and email together usually add a unified reporting layer so marketing and finance read the same numbers, and so channel credit stops being disputed every week.
How do I track Shopify marketing performance across multiple channels?
Connect Shopify, your ad platforms, and your email tool to one workspace, then use Shopify orders as the revenue source of truth. Build a dashboard for each recurring decision and compare platform-reported results against first-party attribution every week. This keeps channel comparisons consistent over time and exposes any platform that claims credit for orders it did not actually drive. Repeat the check weekly so drift shows up early.
How much ad spend is wasted because of poor measurement?
Estimates vary, but all of them are large. A Haus survey reported by eMarketer found that 78% of decision-makers believe at least 10% of spend is wasted because of weak measurement, and 7% say the figure is 30% or more. Smartly’s 2026 research puts the average estimate near 20% of annual digital spend. Better measurement is the cheapest way to recover part of that waste.
What does a marketing analytics platform cost compared with a custom stack?
LayerFive reports that traditional analytics stacks cost $200K to $850K per year, while LayerFive starts at $49 a month. It also reports that brands save $100K to $300K annually by consolidating tools. Your actual cost depends on data volume, the number of connected sources, and the plan you choose, so confirm current pricing on the product page before you budget for it.
Do I need Signal and Juno, or is Axis enough?
Axis alone covers unified dashboards and automated reporting, and many teams start there. Add Signal when you need first-party identity resolution and attribution, since LayerFive reports it identifies 2 to 5 times more visitors than the 5% to 15% industry standard. Add Juno when you want to ask questions of your unified data in plain language. Each layer works on the same underlying numbers.
Is LayerFive secure enough to connect customer and revenue data?
LayerFive is ISO 27001 and SOC 2 Type 2 certified, which are independent audits of how a company secures and manages data. Those certifications do not replace your own due diligence, so review access controls, data retention settings, and role permissions before connecting any customer or revenue source. Start with the least sensitive sources and expand access as your team confirms the setup behaves as expected.
Conclusion
Shopify marketing analytics fails when every platform reports its own version of the truth. The 2026 data is consistent: measurement trust is low, waste is widely suspected, and budgets are flat. The fix is a single reporting layer that joins store revenue with spend and attribution, so decisions rest on numbers everyone accepts. Start with one dashboard and one agreed revenue number, then expand from there.
If you are ready to stop reconciling reports by hand and start measuring what actually works, see how LayerFive approaches Shopify marketing reporting with Axis: https://layerfive.com/axis/.
Sources and key stats used
All statistics below are from 2026 publications.
- Shopify GMV of $119.1 billion in Q3 2026 (up 29%) and $335.5 billion for nine months (up 32%) — Shopify Form 10-Q, 2026: https://www.sec.gov/Archives/edgar/data/0001594805/000159480526000068/shop-20260930.htm
- Shopify Q1 2026 GMV of $100.7 billion — Shopify Form 8-K, May 5, 2026: https://www.sec.gov/Archives/edgar/data/0001594805/000159480526000018/exhibit991pressreleaseq120.htm
- Marketing budgets at 7.8% of revenue, 15.3% of budgets allocated to AI, 30% of organizations ready to scale AI — Gartner 2026 CMO Spend Survey (401 leaders): https://gartner.com/en/newsroom/press-releases/2026-05-11-gartner-2026-cmo-spend-survey-finds-cmos-allocate-15-point-3-percent-of-marketing-budgets-to-ai-but-only-30-percent-are-ready-to-scale-ai-capabilities
- Gartner survey coverage confirming 7.8% of revenue, up from 7.7% — Business Chief, 2026: https://businesschief.com/news/gartner-cmos-face-pressure-to-deliver-ai-growth
- 60% to 75% of buy-side marketers say measurement falls short; AI could unlock $32 billion — IAB State of Data 2026: https://iab.com/insights/2026-state-of-data-report/
- IAB Project Eidos announcement citing the $32 billion estimate — IAB, 2026: https://www.iab.com/news/iab-announces-project-eidos
- 78% of decision-makers believe at least 10% of spend is wasted; 7% say 30% or more — Haus survey via eMarketer, 2026: https://www.emarketer.com/content/confidence-marketing-measurement-falters-budgets-climb
- Only 50% of marketing leaders can explain marketing ROI to the board — Haus survey via Demand Gen Report, April 7, 2026: https://www.pulse.bot/marketing/news/haus-survey-half-of-marketing-leaders-cant-explain-roi-measurement-5ffdcd16-5b71-4db3-9d80-1f60aa66001b/
- 80% of marketers optimize without verified purchase data (survey of 210 senior leaders, March 2026) — Advanced Television, May 22, 2026: https://www.advanced-television.com/2026/05/22/study-80-marketers-optimise-without-verified-purchase-data/
- Respondents estimate about 20% of annual digital spend is wasted — Smartly Digital Advertising Trends, 2026: https://www.smartly.io/digital-advertising-trends/2026
- Ad platform over-claims of 18% (Google), 24% (Meta), 31% (LinkedIn); 78% distrust last-click; 19% use MMM — Visionary Marketing 2026 survey (n=2,400) and audit (n=240): https://visionary-marketing.co.uk/blog/marketing-attribution-statistics-2026
- 60% trust incrementality testing most vs 37% for in-platform reporting (January 2026 survey of 500 US decision-makers) — Digital Applied, August 14, 2026: https://www.digitalapplied.com/blog/marketing-attribution-models-2026-what-still-works
- Axis integrations and features — LayerFive listing on the Shopify App Store: https://apps.shopify.com/layerfive-consumer-management
LayerFive proof points (Billy Footwear 36% revenue growth on 7% more ad spend, 2 to 5 times more visitors identified, $100K to $300K annual savings, $200K to $850K traditional stack cost, ISO 27001 and SOC 2 Type 2) come from LayerFive and are not independent third-party statistics.