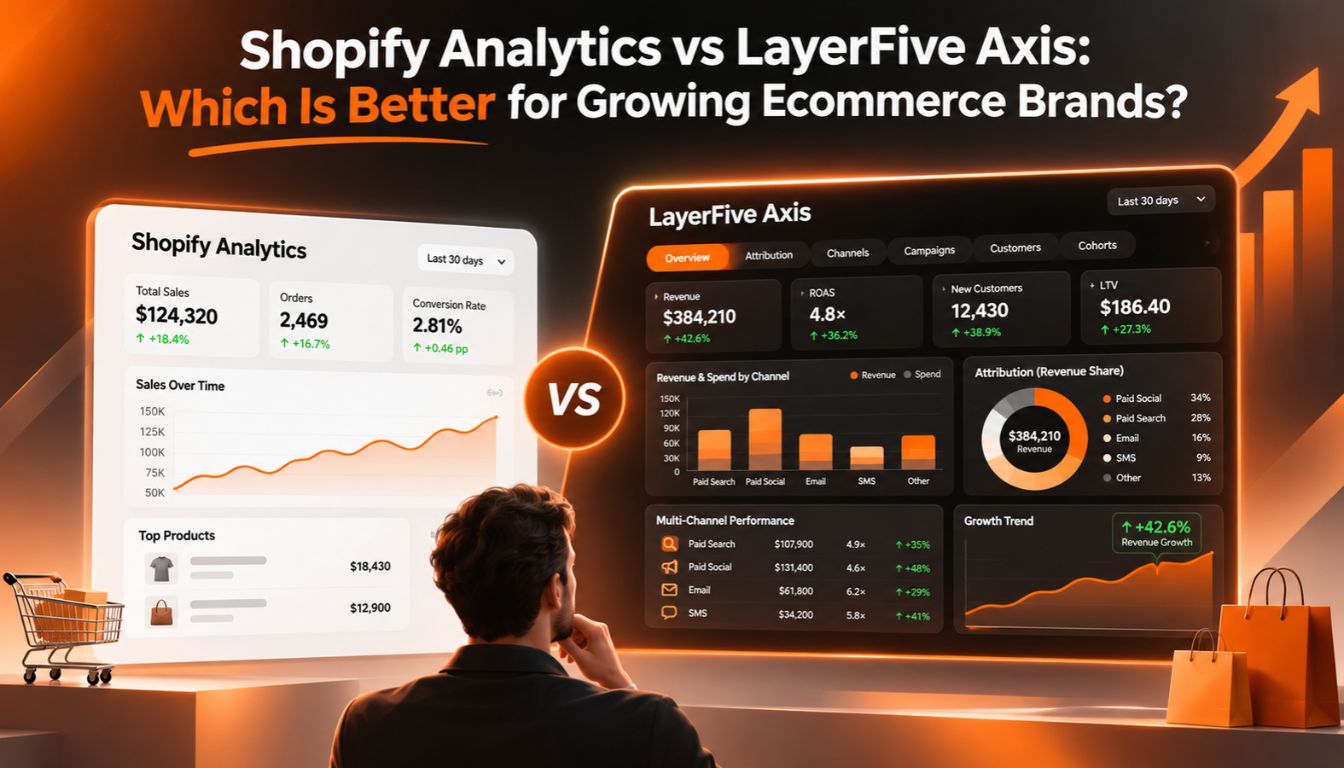
Short answer: Shopify Analytics is the right tool for tracking orders, sessions, and sales inside your store. LayerFive Axis is the better choice once growth depends on paid channels, because it combines Shopify, Google Ads, Meta Ads, and other sources into one revenue-based view. Most growing Shopify brands end up using both: Shopify as the record of what sold, and Axis as the layer that explains which marketing spend produced those sales.
TL;DR
- Shopify Analytics reports what happened in your store. It is included with your plan and is the ground truth for processed orders.
- It cannot see ad spend, ad impressions, or cross-channel journeys, so it cannot tell you which campaign earned a sale.
- Ad platforms over-report. A May 2026 example showed Meta claiming 39% more revenue than Shopify actually recorded.
- Only 37% of senior decision-makers trust in-platform reporting most, versus 60% for independent incrementality testing (Haus survey, January 2026).
- LayerFive Axis connects Shopify with ad platforms and reports revenue, spend, and return on ad spend in one place. Signal improves the visitor identification underneath it.
- Stay on Shopify alone while you run one or two traffic sources. Add Axis when you buy traffic on several platforms or report ROAS to clients or leadership.
- Pricing context: LayerFive starts at $49 per month. Gartner puts the average 2026 marketing budget at 7.8% of company revenue.
Why Compare Shopify Analytics and LayerFive Axis in 2026?
Because the two tools answer different questions. Shopify Analytics reports what happened inside your store. LayerFive Axis reports which marketing activity caused it, across every connected channel. As ad budgets grow and platforms claim overlapping credit for the same sale, brands need both views. Choosing between them is less about features and more about which question you cannot answer today. That is the whole comparison in one paragraph.
The context matters. Shopify merchants cleared $100.74 billion in gross merchandise volume in Q1 2026, up 35% year over year, according to Shopify’s Q1 2026 earnings release. Much of that volume was bought with paid traffic. eMarketer forecasts that global ad spending will reach $1.170 trillion in 2026, and that Google, Meta, and Amazon will take 62.3% of digital ad spend, per reporting on the eMarketer forecast.
A Shopify brand buying traffic is competing in an auction run by three sellers, and each of them grades its own homework. That is the real reason this comparison matters. The reporting tool you pick decides whether you see your own numbers or theirs.
What Does Shopify Analytics Do Well?
Shopify Analytics is the most reliable source for revenue your store actually processed. It reports orders, sessions, conversion rate, average order value, and sales by channel without any setup, and it sits inside the admin where your team already works. For a young store with one or two traffic sources, it covers most reporting needs without adding another subscription or another tool to maintain.
Give it credit. Shopify’s own numbers are the ground truth for what was sold, and no ad platform can overrule them. Every report is built on ShopifyQL, a query language you can use directly inside the report editor. Shopify states that the main features of Shopify Analytics are available on every subscription plan, though specific report availability varies, so check your own admin (First Pier, 2026).
For a brand under a few thousand dollars in monthly sales with organic or single-channel traffic, adding another analytics subscription is usually premature. If that is you, stay native and revisit the decision when ad spend becomes a real line item.
What Changed in Shopify Analytics During 2026?
Shopify added more reporting depth in 2026. ShopifyQL now sits inside every report as a query editor, a Shopify Flow action called Get Analytics data runs scheduled queries, and multi-store queries work through FROM ORGANIZATION. These upgrades make recurring reports easier to automate. They do not change what Shopify can see, which is activity that happens on and through your own storefront.
According to First Pier’s 2026 guide, the Flow action means a recurring report can land in Slack or email without a separate dashboard tool. That is a real improvement for operations teams. It is an upgrade in delivery, though, not in data. A scheduled report of incomplete marketing data is still incomplete marketing data, just on time.
Where Does Shopify Analytics Fall Short for Growing Brands?
Shopify Analytics falls short when the question moves from what sold to what caused the sale. It cannot show ad spend, creative performance, or cost per acquisition from Meta and Google unless you pull that data in separately. Once paid media becomes a meaningful share of revenue, that missing context is where most budget mistakes start, because nobody compares spend to revenue in one place.
This is the gap LayerFive’s breakdown of Shopify analytics limitations covers in detail, and it is the reason brands often compare Shopify Analytics, Google Analytics, and LayerFive side by side. The pattern is consistent. Brands outgrow native reporting not because it is bad, but because their questions get harder than the tool was designed to answer.
Honest counterpoint: you can close part of the gap with spreadsheets and exports. Plenty of teams do. It works until you add a third channel, a second store, or a client who wants weekly numbers. Then somebody spends every Monday morning copying data instead of making decisions.
Why Do Shopify and Meta Report Different Revenue?
Each system counts a different thing. Shopify records completed orders. Meta and Google record conversions they claim credit for, using their own attribution windows and modeling. Both can be internally consistent and still disagree by a wide margin. Dataslayer showed a May 2026 example where Meta reported $128,450 in revenue against $92,130 of actual Shopify order revenue, an overclaim of 39%.
In that same example, Meta reported 2,650 purchases while Shopify recorded 1,850 orders (Dataslayer, 2026). That is one brand’s illustration, not an industry average, so treat it as a demonstration of the mechanism rather than a benchmark. The mechanism is the point. Platforms measure their own contribution generously, and Shopify has no way to push back unless you put the two numbers side by side.
Which number should you trust for budget decisions? Shopify’s, because it reflects money that arrived. Which number tells you which campaign to scale? Neither, on its own.
Can Shopify’s Attribution Models Close the Gap?
Only partly. Shopify’s Channel Performance report on Plus offers seven attribution models, with last click as the default, according to Eightx’s 2026 review. Switching models changes how credit is split among touchpoints Shopify already recorded. It does not add touchpoints Shopify never saw, such as an ad impression, a cross-device visit, or a customer who returned through an untracked path.
That distinction is the heart of the Shopify attribution gap. A model can only redistribute the data it receives. If the journey is half invisible, a better model gives you a more confident answer about half a journey. For a deeper look at how credit models differ, see multi-touch attribution for Shopify.
What Is LayerFive Axis?
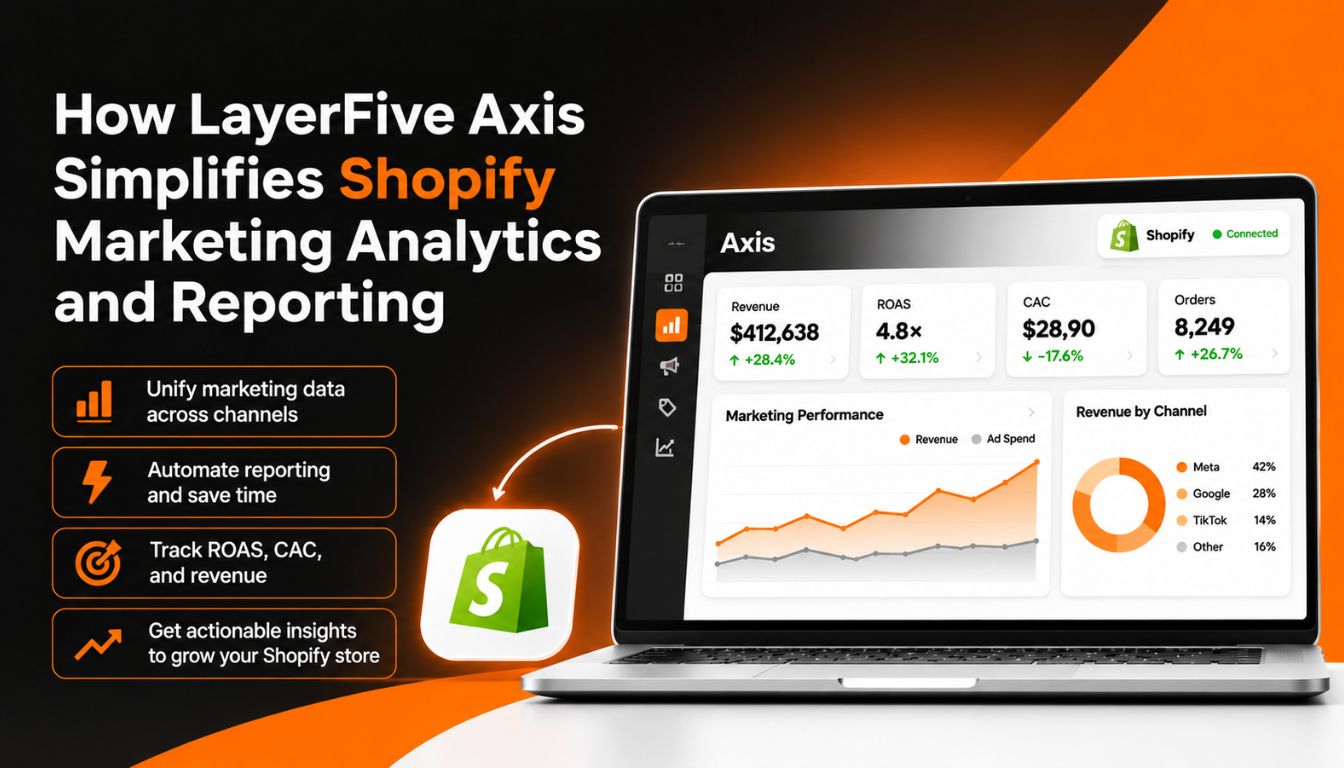
LayerFive Axis is the reporting product inside LayerFive’s marketing intelligence platform. It connects Shopify, Google Ads, Meta Ads, and other marketing sources, then reports revenue, spend, and return on ad spend in one dashboard. Instead of reconciling exports from several tools, a marketer sees one set of numbers tied to actual store revenue. Axis is built for ecommerce brands and for agencies managing multiple clients.
Axis exists because the problem above is structural. The answer is not another chart inside one platform. It is a reporting layer that sits across all of them. Agencies feel this most sharply, which is why LayerFive also publishes guidance on unified client dashboards for marketing agencies.
LayerFive is ISO 27001 and SOC 2 Type 2 certified, which matters if your reporting layer touches customer data and your legal team asks questions. Pricing starts at $49 per month, according to LayerFive.
How Does LayerFive Signal Strengthen Axis Reporting?
Signal is LayerFive’s attribution and identity resolution product. Reporting is only as good as the visitor data underneath it, and Signal works on that layer by recognizing returning visitors across sessions and devices. LayerFive reports that it identifies two to five times more visitors than the industry standard of 5 to 15 percent, which gives Axis more complete customer journeys to report on.
Think of it as two layers. Signal decides who the visitor is and which touchpoints belong to them. Axis turns that into the dashboards your team reads. If you want the mechanics of first-party collection on Shopify, LayerFive’s first-party attribution guide for Shopify walks through it step by step.
Shopify Analytics vs LayerFive Axis: Side-by-Side Comparison
Shopify Analytics is store-centric, included with your plan, and strongest on order data. LayerFive Axis is marketing-centric, connects ad platforms, and is strongest on cross-channel revenue and attribution. The table below breaks the difference down by the capabilities growing brands ask about most, including channel coverage, attribution, multi-client reporting, and the cost of getting started.
Capability Shopify Analytics LayerFive Axis Primary job Reports orders, sessions, and sales inside your store Reports revenue and return on ad spend across all marketing channels Data sources Shopify storefront and connected Shopify channels Shopify, Google Ads, Meta Ads, and other marketing sources Ad spend and ROAS Limited; ad-platform spend needs separate integration Spend and revenue reported side by side Attribution Last click by default; seven models on Plus (Eightx, 2026) Attribution and identity resolution through Signal Cross-channel view Channel sales inside Shopify One view across every connected channel Multi-store or multi-client Multi-store queries via ShopifyQL (First Pier, 2026) Built for agencies and multi-client reporting Visitor identification Session-based Identifies 2–5x more visitors than the 5–15% industry standard (LayerFive) Setup effort None; built into the admin Connect data sources once Starting cost Included with your Shopify plan From $49 per month (LayerFive) Best for Early-stage stores with one or two channels Growing brands and agencies running paid media at scale Read the table as a division of labor, not a scoreboard. Shopify wins on being already there. Axis wins on seeing beyond the storefront.
Which Growing Shopify Brands Need More Than Native Analytics?
Brands need more than native analytics once they run paid media on two or more platforms, report return on ad spend to leadership or clients, or cannot explain why platform dashboards and Shopify totals disagree. Under that threshold, Shopify alone is a reasonable choice. Above it, the cost of unclear reporting usually exceeds the cost of adding a dedicated analytics layer.
Use this checklist. If you answer yes to two or more, native reporting is probably costing you money:
- You advertise on at least two platforms, such as Meta and Google.
- Your ad platforms report more revenue than Shopify recorded.
- You report ROAS to a client, investor, or executive team.
- You manage more than one store or more than one brand.
- You spend time every week reconciling exports by hand.
The market has options. Brands often evaluate Triple Whale, Northbeam, Hyros, GA4, and Supermetrics alongside LayerFive, and each fits a different need. GA4 is the usual starting point for web analytics, and LayerFive’s comparison of GA4 and LayerFive Axis explains where it stops. For a broader shortlist, see the best ecommerce analytics platform for Shopify brands.
Why Is Ad Platform Reporting Losing Trust in 2026?
Because marketers have tested it and found it lacking. In a January 2026 Haus survey of 500 senior US decision-makers, 60% said they trust independent incrementality testing most, compared with 40% for media mix modeling and 37% for in-platform reporting, as reported through eMarketer by Digital Applied. In-platform numbers still steer most budgets, yet far fewer people trust them.
Trust in measurement is not a niche concern. A 2026 survey of 101 B2B and B2C marketers found that 75% consider attribution mission critical or very important (Straight North, 2026). The sample is small and the answers are self-reported, so read it as directional. The direction is clear, though: nearly everyone says attribution matters, and fewer trust what they have.
The honest takeaway is that no single report settles this. Incrementality tests, media mix models, and first-party attribution each catch something the others miss. What you can control is the foundation: one set of revenue numbers that comes from your own store and your own visitor data, not from the platform selling you the ads.
How Do You Unify Shopify, Google Ads, and Meta Ads Reporting?
Connect all three sources to one reporting layer, match ad spend to Shopify orders by campaign and date, then report on revenue rather than platform-claimed conversions. The steps below show the process. It takes an afternoon with a tool built for it and weeks with spreadsheets, and the spreadsheet version breaks every time a platform changes its export format.
- Connect Shopify first. It is your source of truth for orders and revenue.
- Connect Google Ads and Meta Ads. Pull spend, clicks, and campaign names, not just platform-reported conversions.
- Standardize campaign naming and UTM parameters. Inconsistent naming is the most common reason spend and revenue fail to match.
- Match spend to Shopify orders. Join on campaign and date so each dollar sits next to the revenue it plausibly produced.
- Report ROAS on Shopify revenue. Treat platform-reported conversions as a reference point, not the answer.
- Review the gap every week. A widening gap between platform revenue and Shopify revenue is a signal to investigate, not a number to explain away.
LayerFive Axis automates steps 1 through 5. If you want to see what the finished view looks like, the Meta and Google Ads dashboard guide shows the layout, and the walkthrough on a marketing analytics tool for Shopify, Meta, Google Ads, and Klaviyo covers adding email data to the mix.
What Does a Real Result Look Like? The Billy Footwear Example
Billy Footwear grew revenue 36% with only 7% additional ad spend after adopting LayerFive, according to LayerFive’s case study. The result came from reallocating budget toward the channels and campaigns that produced revenue rather than the ones that reported the most conversions. It is one brand’s outcome and not a guarantee, but it shows what better measurement can change.
The mechanism is simple. When reporting shows which campaigns drive actual orders, budget moves from underperformers to winners. Spend goes up a little. Revenue goes up a lot. That ratio, 36% revenue growth against 7% more spend, is what unified measurement is supposed to produce. Results vary with channel mix, margins, and starting data quality, so treat the case study as a reference for what is possible rather than a forecast for your store.
Where Does LayerFive Juno Fit After Reporting?
Juno is LayerFive’s agentic AI product, formerly called Navigator. It works from the same unified data that powers Axis rather than from disconnected exports, which is what makes AI output on marketing data trustworthy. Gartner’s 2026 CMO Spend Survey found that 70% of CMOs call becoming an AI leader a critical 2026 goal while only 30% report fully developed AI readiness.
That gap is mostly a data problem. AI tools built on fragmented, mismatched numbers produce confident wrong answers faster. Clean, unified data is the practical first step, and Juno is where that data gets put to work. If you are earlier in the journey, start with reporting. Axis and Signal come first, and AI comes after the numbers can be trusted.
What Should You Budget for Analytics in 2026?
Budget for analytics as a small share of a marketing budget that is itself under pressure. Gartner’s 2026 CMO Spend Survey of 401 marketing leaders found the average marketing budget at 7.8% of company revenue, up marginally from 7.7% in 2025. The CMO Survey (Deloitte, Duke University, AMA) puts its broader sample at 9.0%. Flat budgets raise the bar for measurement.
Run the numbers on a hypothetical brand. At $5 million in annual revenue, a 7.8% marketing budget is $390,000. A LayerFive plan starting at $49 per month costs $588 per year, about 0.15% of that budget. LayerFive states that traditional marketing stacks cost $200,000 to $850,000 per year, so the comparison to a full legacy stack is wider still. These are illustrations, and your plan, volume, and needs will set the actual price.
Gartner also found that CMOs allocate 15.3% of marketing budgets to AI initiatives (Gartner, 2026). When budgets are flat and AI claims a growing slice, every dollar that goes to ads needs a clearer return. That argues for measurement first.
FAQ
Q: What is the difference between Shopify Analytics and LayerFive Axis?
A: Shopify Analytics reports what happens inside your store: orders, sessions, conversion rate, and sales by channel. LayerFive Axis connects Shopify with ad platforms such as Google Ads and Meta Ads and reports revenue, spend, and return on ad spend in one view. Shopify answers what sold. Axis answers which marketing spend produced it.
Q: Is Shopify Analytics enough for a growing ecommerce brand?
A: It is enough while you run one or two traffic sources and a small ad budget. It stops being enough when you buy traffic on several platforms and need to compare spend against revenue by channel. At that point, a dedicated layer such as LayerFive Axis closes the gap.
Q: What is the best alternative to Shopify Analytics?
A: The best alternative depends on the gap you need to close. Brands that need cross-channel reporting and attribution commonly evaluate tools such as LayerFive Axis, Triple Whale, and Northbeam. LayerFive Axis suits brands and agencies that want reporting, attribution, and identity resolution in one platform, starting at $49 per month.
Q: How does LayerFive Axis improve Shopify marketing reporting?
A: Axis connects ad spend and store revenue, then reports return on ad spend against actual Shopify revenue instead of platform-claimed conversions. Paired with LayerFive Signal, it also identifies more visitors, so customer journeys are more complete. Marketers see one set of numbers instead of reconciling exports.
Q: How do I unify Shopify, Google Ads, and Meta Ads reporting?
A: Connect all three to one reporting layer, standardize campaign names and UTM parameters, match spend to Shopify orders by campaign and date, and report ROAS on Shopify revenue. A platform like LayerFive Axis automates this. Spreadsheets can do it, but they break whenever an export format changes.
Q: Why does Meta report more revenue than Shopify?
A: Meta counts conversions it claims credit for using its own attribution windows and modeling, while Shopify counts completed orders. Dataslayer documented a May 2026 example where Meta reported $128,450 against $92,130 of Shopify revenue, a 39% overclaim. Use Shopify as the revenue ground truth and treat platform numbers as reference points.
Q: Does Shopify Analytics support multi-touch attribution?
A: Shopify’s Channel Performance report on Plus offers seven attribution models, including linear, time decay, and position-based, according to Eightx in 2026. These models redistribute credit among touchpoints Shopify recorded. They do not add ad impressions or untracked cross-device visits, which is where dedicated attribution such as LayerFive Signal helps.
Q: Is LayerFive secure enough for customer data?
A: LayerFive is ISO 27001 and SOC 2 Type 2 certified. These are independent security and controls certifications that many legal and IT teams require before approving a vendor that handles customer data.
Q: How much does LayerFive Axis cost compared with a traditional analytics stack?
A: LayerFive starts at $49 per month. LayerFive states that traditional marketing stacks cost $200,000 to $850,000 per year, and that brands save $100,000 to $300,000 annually by consolidating tools. Your actual cost depends on your plan and data volume.
Q: Should I use Shopify Analytics and LayerFive Axis together?
A: Yes. Shopify remains the source of truth for orders and operations. Axis layers marketing spend and attribution on top, so budget decisions rest on revenue instead of platform-claimed conversions. Most growing brands keep both.
Conclusion
Shopify Analytics tells you what sold, and it does that job well. It cannot tell you which campaign sold it, because it never sees ad spend or most of the journey. That is the dividing line in Shopify Analytics vs LayerFive Axis: one is the record of your store, the other is the record of your marketing.
In 2026, with budgets flat at 7.8% of revenue and in-platform reporting trusted by only 37% of senior decision-makers, guessing is expensive. Keep Shopify for orders. Add a reporting layer built on your own revenue data when paid media becomes a real share of growth.
If you are ready to stop guessing and start measuring what actually works, see how LayerFive approaches Shopify marketing reporting: LayerFive Axis.
KEY STATS USED (for fact-checking)
All third-party figures are 2026 data. LayerFive figures are company-reported.
- Shopify Q1 2026 GMV of $100.74 billion, up 35% year over year; revenue of $3.17 billion, up 34% — Shopify Q1 2026 earnings release, 2026
- Global ad spending to reach $1.170 trillion in 2026 — eMarketer, Worldwide Ad Spending H1 2026
- Google, Meta, and Amazon to account for 62.3% of global digital ad spend in 2026; Meta forecast at $243.46 billion vs Google at $239.54 billion — eMarketer forecast, as reported by MediaNews4U, 2026
- Meta reported $128,450 revenue and 2,650 purchases vs Shopify’s $92,130 and 1,850 orders in May 2026, a 39% overclaim (single-brand illustration) — Dataslayer, 2026
- Shopify Plus Channel Performance report supports seven attribution models, last click by default — Eightx, 2026
- ShopifyQL in every report, Flow “Get Analytics data” action, multi-store queries via FROM ORGANIZATION; main analytics features on every plan — First Pier, 2026
- 60% of senior decision-makers trust incrementality testing most, vs 40% for MMM and 37% for in-platform reporting (survey of 500 senior US decision-makers, January 2026) — Haus survey via eMarketer, reported by Digital Applied, 2026
- 75% of marketers consider attribution mission critical or very important (survey of 101 marketers, self-reported) — Straight North, 2026
- Average marketing budget 7.8% of company revenue (up from 7.7% in 2025); 15.3% of budgets to AI; 70% of CMOs call AI leadership critical; 30% report full AI readiness; 401 marketing leaders surveyed January–March 2026 — Gartner 2026 CMO Spend Survey, 2026
- Average marketing budget of 9.0% of revenue — The CMO Survey (Deloitte, Duke University, AMA), Spring 2026, as summarized by Whitehat
- Billy Footwear: 36% revenue growth with 7% additional ad spend; 2–5x more visitors identified vs the 5–15% industry standard; from $49 per month; $100,000–$300,000 annual savings; traditional stacks $200,000–$850,000 per year; ISO 27001 and SOC 2 Type 2 — LayerFive, company-reported
Shopify Marketing Analytics: How LayerFive Axis Simplifies Reporting
Quick answer Shopify marketing analytics works best when store orders, ad spend, email revenue, and site behavior sit in one